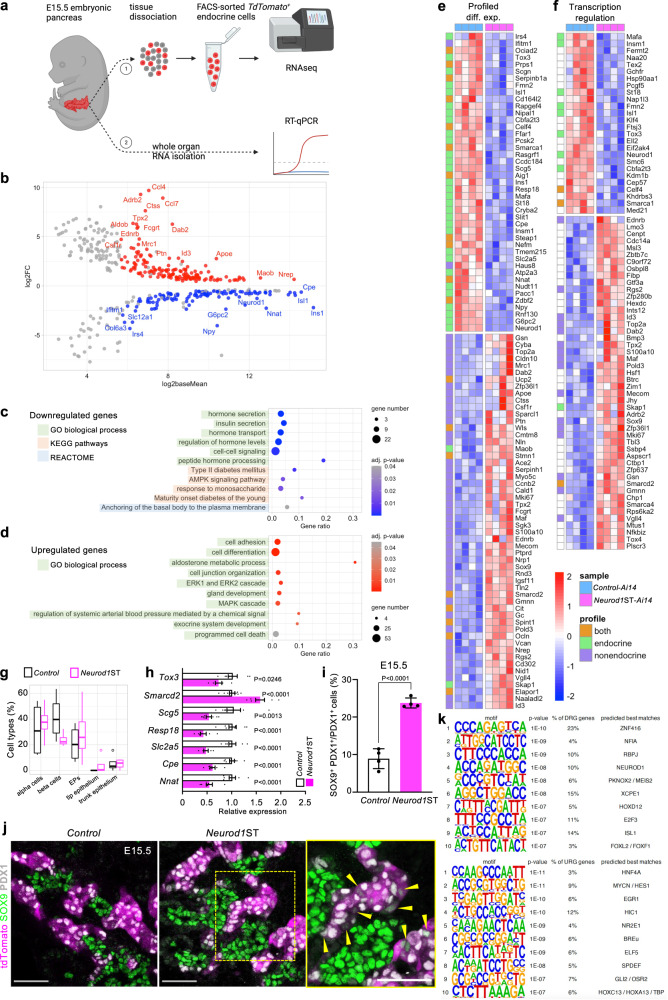
Fig. 4. Neurod1 elimination disrupts gene regulatory network in the developing endocrine cells.
a RNA sequencing experiment design—1: The embryonic pancreases (E15.5) were extracted and dissociated into single cells. Endocrine tdTomato+ cells were collected using FACS (100 cells/sample, 4 samples/genotype). Lysed cells total RNA served as template for RNA-seq library preparation. 2: Whole extracted E15.5 pancreases were lysed and used for RT-qPCR validation of several differentially expressed endocrine-specific genes identified by RNA-seq. Created with BioRender.com. b RNA-seq data analysis identified 422 differentially expressed genes with 112 downregulated and 153 upregulated protein-coding genes (see also Supplementary data). c Downregulated gene functional enrichment (Gene Ontology [GO] biological processes, KEGG pathways, REACTOME). d Upregulated GO enrichment (biological processes). e Profiled differential expression heatmap: All differentially expressed genes with affiliation to endocrine/non-endocrine single cell expression profile. f Transcription regulation heatmap: Differentially expressed genes identified in transcription regulation cluster. g Boxplots show the deconvolved cell type percentage in E15.5 endocrine population from our bulk RNA-seq data (circle marks identified outliers). Centerline of the boxplot indicates the median, the box extends from the 25th to 75th percentiles, and the whiskers represent the rest of the data distribution. h RT-qPCR validation of several identified differentially expressed genes at E15.5 in the whole pancreas. Relative mRNA expression data are presented as mean ± SEM (n = 8 pancreases/Control and 7 pancreases/Neurod1ST), unpaired two-tailed t test, ****p < 0.0001, ***p < 0.001, **p < 0.01, *p < 0.05). Source data are provided as a Source Data file. i Quantification of cells co-expressing SOX9 and PDX1. Data are presented as mean ± SD; (n = 4 pancreases/genotype); unpaired two-tailed t test. Source data are provided as a Source Data file. j Representative confocal microscopy images of tdTomato+ cells and immunolabeled SOX9, insulin (INS), and PDX1 cells. A box indicates the area magnified in the right panel. Arrowheads indicate tdTomato+ cells co-expressing SOX9 and PDX1. Scale bars, 50 µm. k Top 10 transcription factors identified by de novo motif enrichment analysis of differentially expressed genes.

