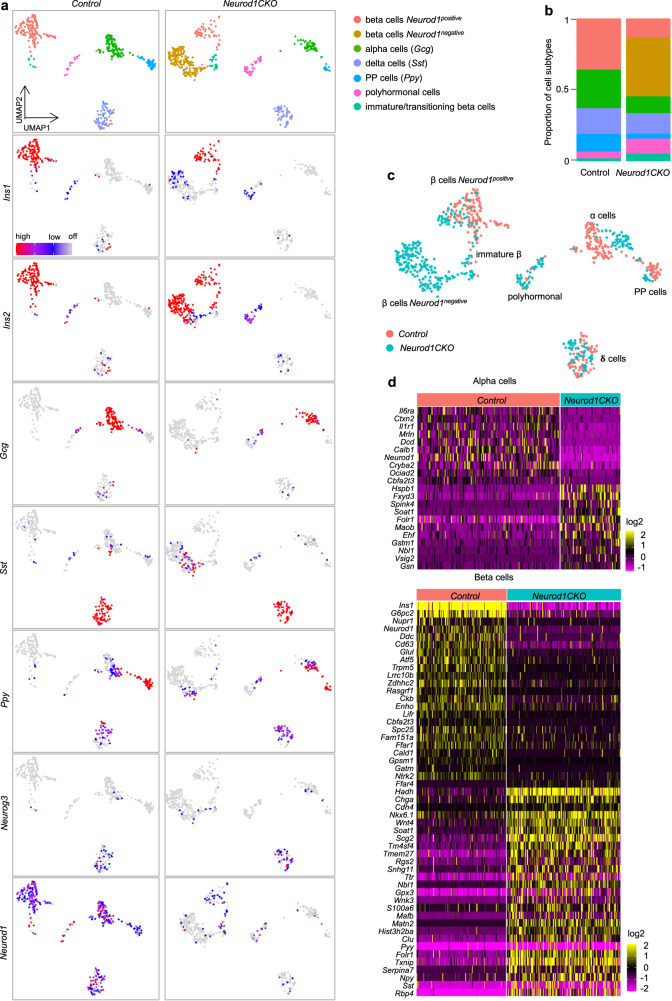
Fig. 6. Molecular identity of the β-cell subpopulation is altered by Neurod1 deletion.
a Two-dimensional embedding and unsupervised clustering of endocrine profiles from Control pancreatic islets revealed six cell clusters, identified by markers shown in a cropped and transformed UMAP plots: β cells (Ins1, Ins2), α cells (glucagon, Gcg), PP cells (pancreatic polypeptide, Ppy), polyhormonal cells (expressing Ins1, Ins2, Gcg, Sst, or/and Ppy), immature/transitioning β cell cluster (Ins1, Ins2), and δ cells (Sst). The detected clusters are indicated by different colors. In Neurod1CKO, endocrine profiles revealed the same six cell clusters with one additional cluster representing a molecularly different β-cell subpopulation. b Cellular composition per sample. c UMAP plot showing the distribution of endocrine cells from the Control and Neurod1CKO. d Heatmaps of differentially expressed genes between Control and Neurod1CKO in α and β cells (cut off: Padj < 0.05, log2FC = 0.6).

