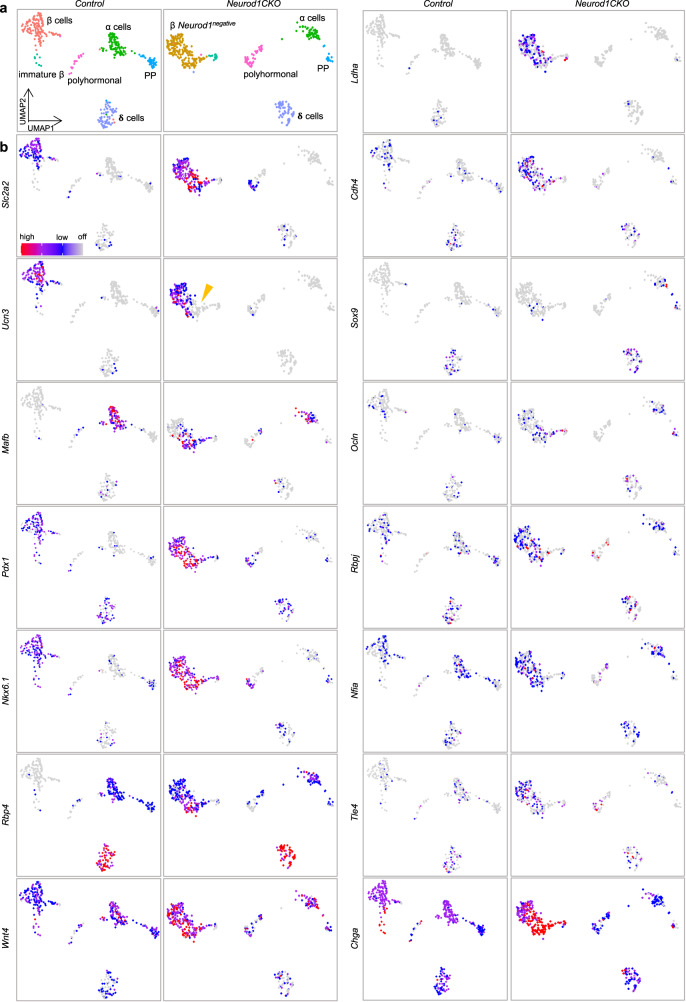
Fig. 7. Molecular reprograming of Neurod1CKO endocrine cells.
a UMAP visualization (in two dimensions [UMAP_1 and UMAP_2]) of endocrine cells from the adult Control and Neurod1CKO pancreas (different colors mark distinct cell types annotated based on the expression of signature genes; each dot represents one cell). Clusters corresponding to α, β, PP (γ), δ, polyhormonal cells, immature β, and β cells not expressing Neurod1 (in Neurod1CKO) are shown in cropped and transformed UMAP plots that excludes a cluster of β cells expressing Neurod1 in Neurod1CKO plots for easier visualization. b Feature plots showing differentially expressed genes between Control and Neurod1CKO endocrine cells.

