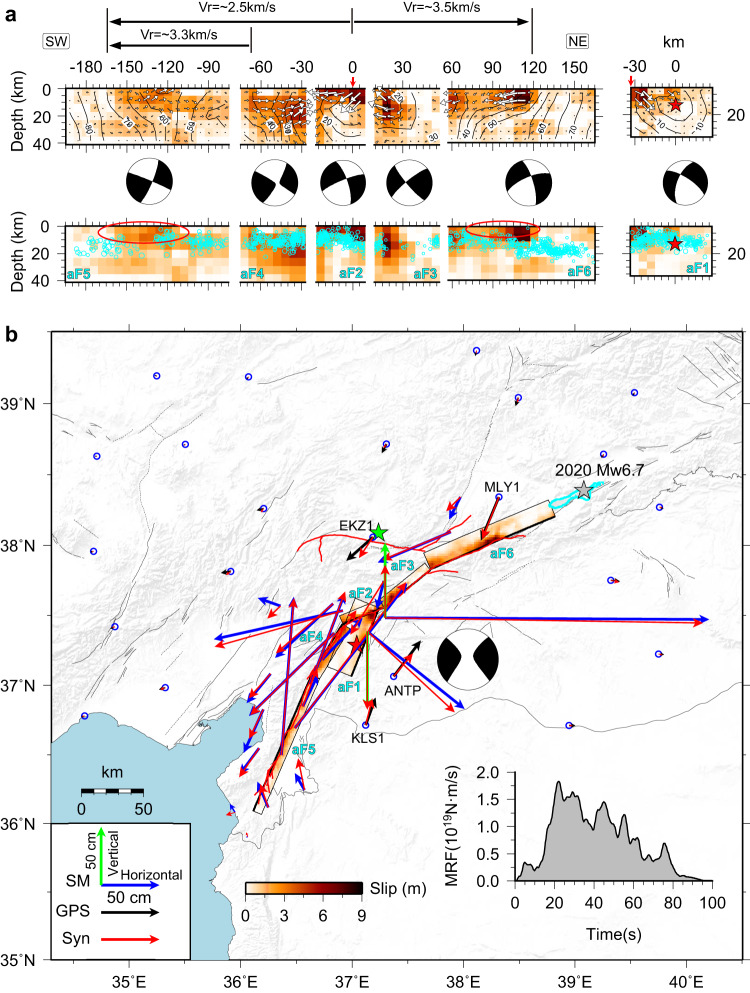
Fig. 3. Preferred slip model of the MW 7.8 earthquake.
a The inverted slip distribution on six fault segments; the fault parameters are listed in Supplementary Table 2. The red star locates the hypocenter on aF1. White contours indicate the slip initiation time with an interval of 5 s. White arrows indicate the direction and amplitude of the slip. Gray circles indicate aftershocks with M ≥ 2.5 less than 20 km in the fault-normal distance from each non-overlapping segment (closer near the intersecting segments), and the size is scaled by magnitude. The red ovals outline possible supershear regions, with a notable paucity of aftershocks. Focal mechanisms are the equivalent moment tensors of each fault segment. Black arrows highlight the different average rupture propagation velocities in the northeast and southwest directions. Red vertical arrows mark the intersection of the aF1 and aF2 segments. b Comparison between the observed and synthetic coseismic displacements are shown in Fig. 2, and a map view of the preferred slip model. The red, green, and gray stars show epicenters of the 2023 earthquake doublet and the 2020 event, respectively. The cyan curve outlines the coseismic slip (≥0.5 m) of the 2020 Doğanyol-Sivrice MW 6.7 event29. The focal mechanism represents the calculated moment tensor for the composite faulting from this study. Black thin lines represent active faults. The red lines represent positions of fault ruptures detected by post-earthquake satellite data. The inset shows the moment-rate function (MRF) of the joint inversion model.

