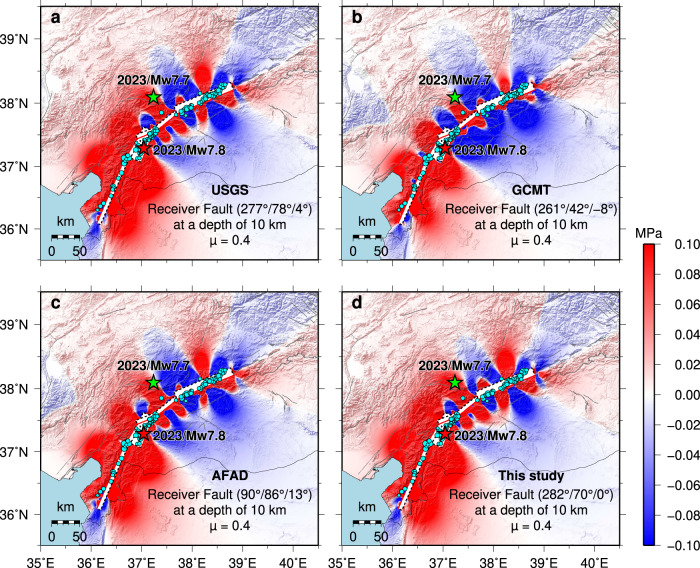
Fig. 6. Coulomb stress change caused by the mainshock on receiver (target) faults with the same geometry as the initial segment of the MW 7.7 event from different analyses.
a, b, c, and d represent the calculated results using different receiver fault parameters, at a depth of 10 km, with an effective friction coefficient of 0.4. The red and green stars show epicenters of the MW 7.8 and MW 7.7 events, respectively. The cyan-filled circles are the relocated aftershocks scaled by magnitude that occurred in the 9 h between the MW 7.8 and MW 7.7 events. Gray thin lines show the active faults.

