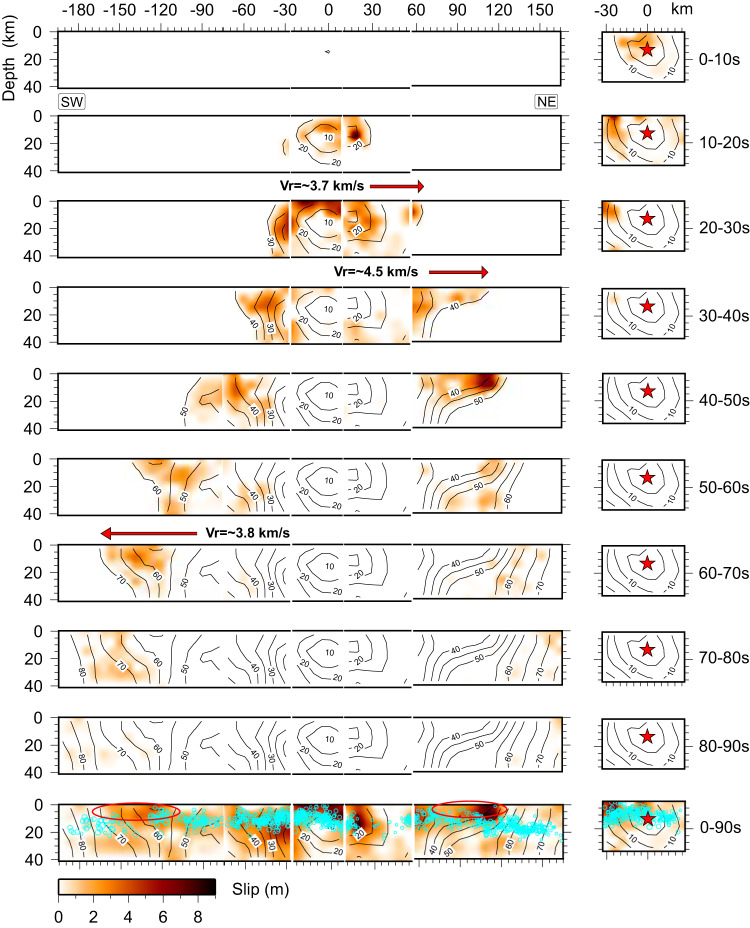
Fig. 8. Slip time interval snapshots that highlight the supershear rupture segments for the MW 7.8 event.
The red-filled star indicates the hypocenter. Black contours represent the slip initiation time with an interval of 5 s. Cyan circles in the lower panel indicate the relocated aftershocks, with the radius scaled by magnitude. The red ovals and red arrows highlight shallow fault stretches with inferred supershear rupture, which has a notable paucity of aftershocks.

