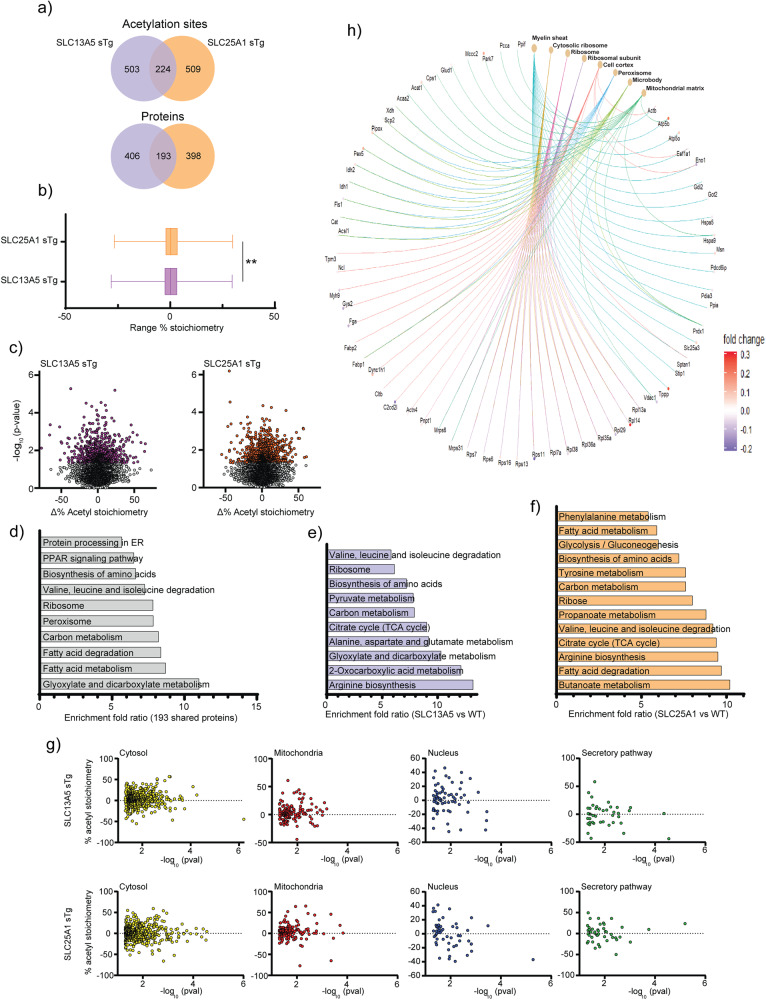
Fig. 4. SLC25A1 sTg and SLC13A5 sTg mice show widespread changes in stoichiometry of lysine acetylation.
a Venn diagram showing overlap between SLC13A5 sTg and SLC25A1 sTg mice across statistically significant acetylation sites (upper panel) and acetylated proteins (lower panel). b Histogram showing the distribution of all stoichiometry of acetylation changes from WT in SLC13A5 sTg and SLC25A1 sTg mice. Data are represented as box and whisker plots: box represents 25th to 75th inner quartile range with middle line denoting the median and the inner square denoting the mean; whiskers represent the interquartile distance with a coefficient of 1.5. **P < 0.005 via the Kolmogorov-Smirnov test. c Volcano plots displaying stoichiometry of acetylation changes from WT in SLC13A5 sTg and SLC25A1 sTg mice. Statistically significant sites are shown in purple for SLC13A5 sTg mice and orange for SLC25A1 sTg mice. P < 0.05 via Fisher’s method with all other sites in gray (n = 5 male mice per group). d The fold enrichment of KEGG pathways determined from proteins harboring the acetylation sites that were significantly changed from WT mice. Proteins (total of 193) that are in common between SLC13A5 and SLC25A1 sTg mice are shown. The top 10 categories sorted by enrichment score (>5) are shown with a filtered FDR score of 0.05. e The fold enrichment of KEGG pathways determined from proteins harboring the acetylation sites that were significantly changed from WT mice. Proteins (total of 406) that are unique to SLC13A5 sTg mice are shown. The top 10 categories sorted by enrichment score (>5) are shown with a filtered FDR score of 0.05. f The fold enrichment of KEGG pathways determined from proteins harboring the acetylation sites that were significantly changed from WT mice. Proteins (total of 398) that are unique to SLC25A1 sTg mice are shown. The top 13 categories sorted by enrichment score (>5) are shown with a filtered FDR score of 0.05. g Distribution of proteins harboring the acetylation sites that were significantly changed from WT mice according to their Uniprot subcellular annotation. Proteins are arranged by cellular location. P < 0.05 via one way ANOVA. h Gene-network plots of proteins (total of 193) harboring the acetylation sites that were significantly changed from WT and shared by SLC13A5 and SLC25A1 sTg mice. Plots constructed via an overrepresentation analysis using the GO cellular component function database. The dot size of each network category is scaled by the number of overlapping proteins within the category. The top 8 categories sorted by enrichment score are shown with a filtered FDR score of 0.05.

