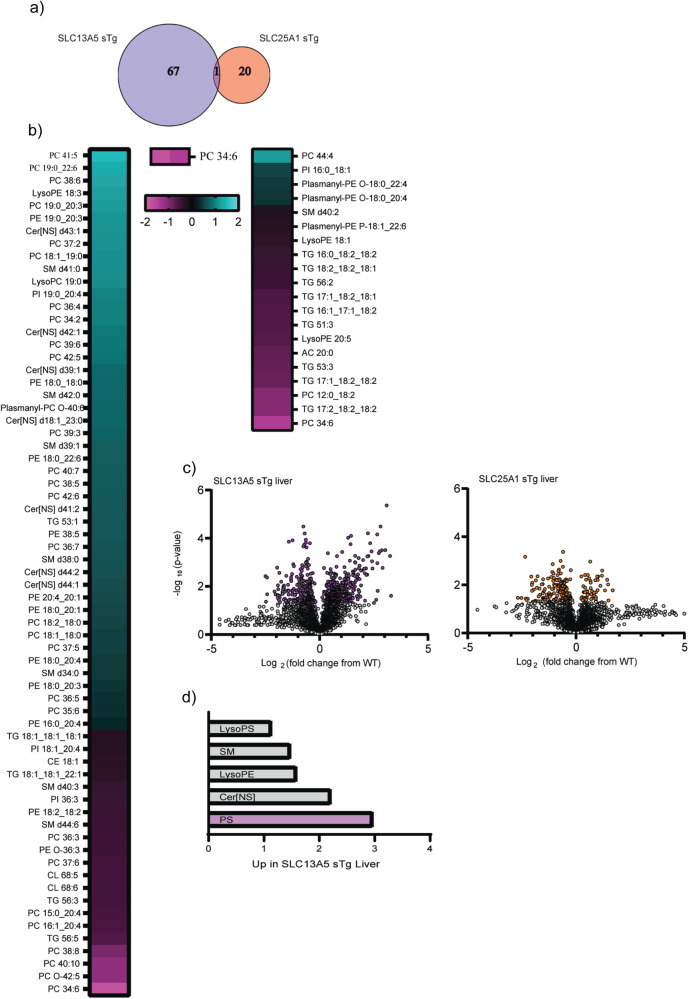
Fig. 6. SLC13A5 sTg and SLC25A1 sTg mice display different lipid adaptation in the liver.
a Venn diagram showing overlap between SLC13A5 sTg and SLC25A1 sTg mice across statistically significant lipids (n = 5 male mice per group). b Heat-map showing the expression profile of dysregulated lipids found in SLC13A5 sTg and SLC25A1 sTg mice as compared to WT littermates. c Volcano plot displaying all quantified lipids in SLC13A5 sTg and SLC25A1 sTg livers, as compared to age-matched WT littermates. Statistically significant species are highlighted in purple (for SLC13A5 sTg) and orange (for SLC25A1 sTg). P < 0.05 via Fisher’s method with all other species in gray. d Bar graph representing up-regulated groups of lipids in SLC13A5 sTg liver samples. Statistically significant groups represented in purple.

