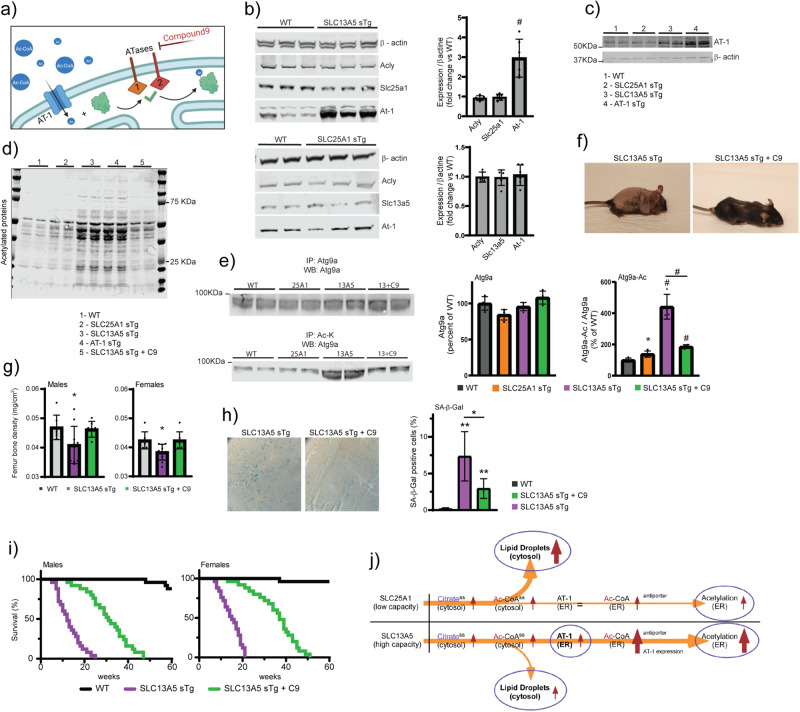
Fig. 7. ATase1/ATase2 inhibition rescues the progeria-like phenotype and lifespan of SLC13A5 sTg mice.
a Schematic view of the ER acetylation machinery with compound 9 acting on the ATases downstream of AT-1. b Western blot showing expression of different target proteins in SLC13A5 sTg and SLC25A1 sTg mice. Representative Western blot (left) and quantification (right) are shown. #P < 0.0005 via mean comparison using Student’s t test (n = 6 male mice per group). c Western blot showing expression of AT-1 and β-actin proteins. d Western blot showing the profile of Nε-lysine acetylation in the ER isolated from liver. e Western blot showing the acetylation profile of ER-bound Atg9a. Representative Western blot (left) and quantification (right) are shown (Atg9a, total Atg9a; Atg9a-Ac, acetylated Atg9a). f Representative images of SLC13A5 sTg with and without C9 treatment. Mice were 120 days old. g Femur bone density from SLC13A5 sTg animals with and without C9 treatment. *P < 0.05 via mean comparison using Student’s t test (WT, n = 7; SLC13A5 sTg, n = 10; SLC13A5 sTg + C9, n = 7). h SA-β-Gal staining of liver slides from SLC13A5 sTg animals with and without C9 treatment. Representative images and quantification of results are shown. *P < 0.05 via mean comparison using Student’s t test (n = 4 mice/group; 150 cells/animal). i Lifespan of SLC13A5 sTg mice with and without C9 treatment (n = 25/group). P < 0.0005 via Kaplan–Meir lifespan test. j Schematic summary of the different adaptive response elicited by overexpression of SLC25A1 and SLC13A5 (ss, steady state).

