Fig. 3.
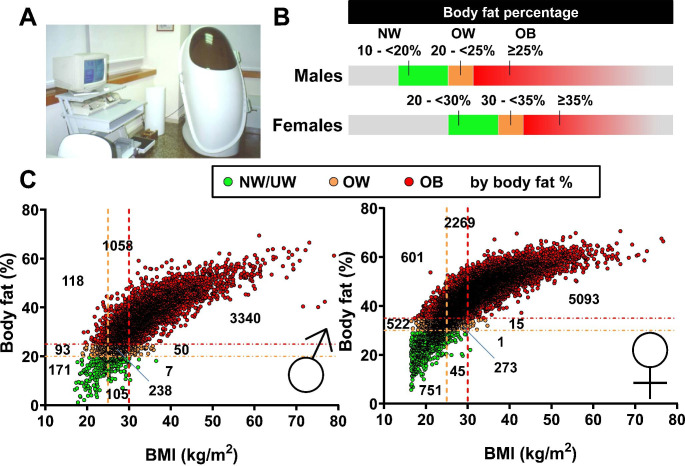
Body mass index (BMI) misclassifies a high number of patients with overweight or obesity defined by body fat percentage (BF%). (A) Air displacement plethysmography equipment used to estimate BF% in people with a BMI ≥ 16.5 kg/m2 attending the Department of Endocrinology and Nutrition at the Clínica Universidad de Navarra in Pamplona, Spain. (B) Cut-off points used to define overweight and obesity according to BF% in men and women. (C) Correlation between BMI and BF% of a sample of 14,750 individuals stratified by gender. Left: Men (n = 5,180). Right: Women (n = 9,570). Vertical dashed lines indicate cut-offs for defining overweight (OW) and obesity (OB) according to BMI (25.0 and 30.0 kg/m2, respectively) while horizontal lines indicate cut-offs for defining OW and OB according to BF% (20.0 and 25.0% in males and 30.0 and 35.0% in females, respectively). The number of subjects in each quadrant is indicated. Colors denote normal weight/underweight (NW/UW), OW or OB according to BF%

