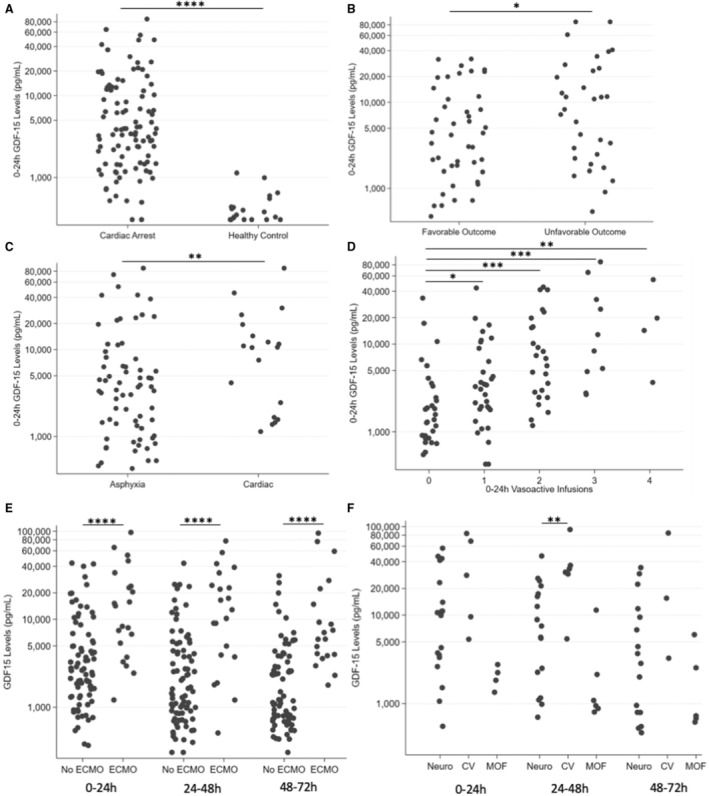
Figure 1. Association of GDF‐15 with event cause and CV after pediatric CA.

A, GDF‐15 levels are increased at 0 to 24 hours after CA (N=100) compared with healthy controls (N=20) (P <0.0001, Wilcoxon rank sum). B, Increased GDF‐15 levels at 0 to 24 hours postarrest are associated with unfavorable outcome at 1 year (N=44, favorable outcome, N=32 unfavorable outcome) (P <0.05, Wilcoxon rank sum). C, GDF‐15 levels are elevated at 0 to 24 hours in arrests of a cardiac cause (N=19) compared with arrests of a respiratory cause (N=68) (P <0.01, Wilcoxon rank sum). D, Increased GDF‐15 levels are associated with increasing vasoactive infusion use in the first 24 hours postarrest (N=29, 0 infusions; N=32, 1 infusion; N=25, 2 infusions; N=10, 3 infusions; N=4, 4 infusions) (P=0.0001, Kruskal–Wallis; post‐hoc Wilcoxon rank sum P <0.05, P <0.001, P <0.001, and P<0.01, respectively). E, GDF‐15 levels were markedly increased in patients with CA who required ECMO (N=21) compared with those who did not require ECMO (N=79) (P <0.0001, Wilcoxon rank sum comparison of 0‐ to 24‐hour levels). This finding persisted at later timepoints (P <0.0001 at 24–48 hours and 48–72 hours), total patients requiring ECMO (N=23) vs no ECMO (N=88). F, GDF‐15 levels differed in patients by mechanism of death. At 0 to 24 hours, there were serum samples from 19 patients who died from severe neurologic injury or brain death, 5 patients who died from cardiovascular failure, and 4 patients who died from multi‐organ failure (P <0.05, Kruskal–Wallis). At 24–48 hours, there were serum samples from 17 patients who died from neurologic injury or brain death, 6 patients who died from cardiovascular failure, and 6 patients who died from multi‐organ failure (P <0.01, Kruskal–Wallis). At 24–48 hours postarrest, GDF‐15 levels in patients who died from cardiovascular failure were significantly higher than in patients who died from neurologic injury or brain death (P <0.01, post‐hoc Wilcoxon rank sum). CA indicates cardiac arrest; CV, cardiovascular failure; ECMO, extracorporeal membrane oxygenation; GDF‐15, growth differentiation factor‐15; MOF, multi‐organ failure; and Neuro, neurologic injury or brain death. Each timepoint was evaluated independently (no repeated‐measures analysis was performed). All plots have the y‐axis on a log scale. *P <0.05, **P <0.01, ***P <0.001, ****P <0.0001.
