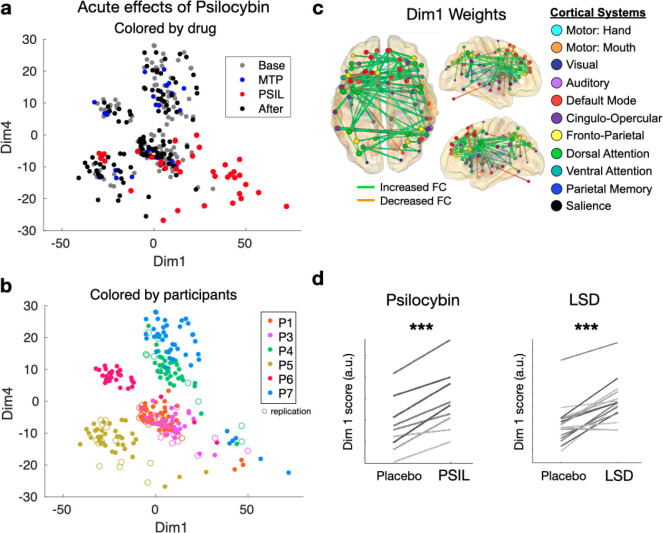
Figure 2. Multi-dimensional Scaling identifies acute and persistent drug effects.
In the scatter plots, each point represents the functional network from a single scan, plotted in a multidimensional space based on the similarity between scans. Replication scans are represented with open circles. a) Dimensions 1 and 4 are plotted for every 15-minute scan. In the top panel, points are colored based on drug condition. In the bottom panel, points are colored based on participant identity. Dimension 1 separates psilocybin from non-drug and MTP scans in most cases. Dimension 4 separates individuals in most cases and shows a small but significant before/after effect. C) Visualization of dimension 1 weights (top 1% of edges are projected onto the brain to show the connections most effected by psilocybin). D) In additional datasets with LSD (top) and psilocybin (bottom), psychedelic causes reliable change along dimension 1.

