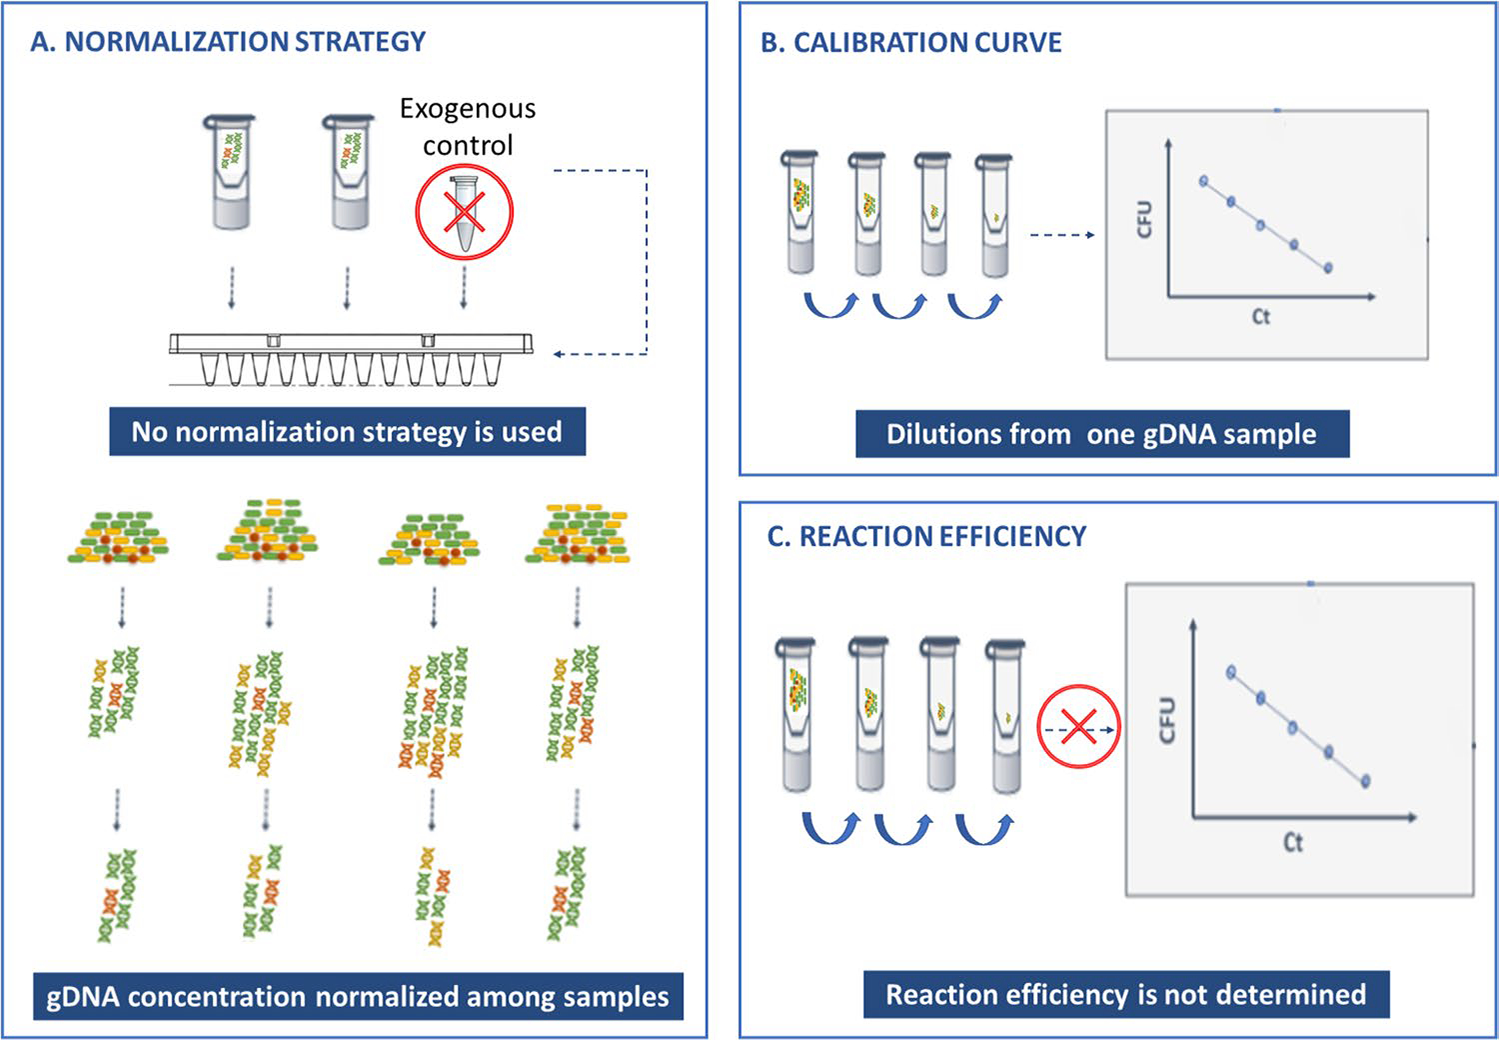
Fig. 3.

Common flaws when quantifying bacterial load using qPCR. In most of the studies surveyed, (A) DNA extraction normalization was not performed (or described) or was normalized by total gDNA concentration, which can bias the results. Often (B), the qPCR/bacterial load calibration curve is performed by diluting a known gDNA sample, but this fails to consider the different extraction efficiencies at different bacterial concentrations. Also (C) some studies failed to consider the qPCR reaction efficiency that needs to be determined for each primer set and varies according to reagent and equipment used
