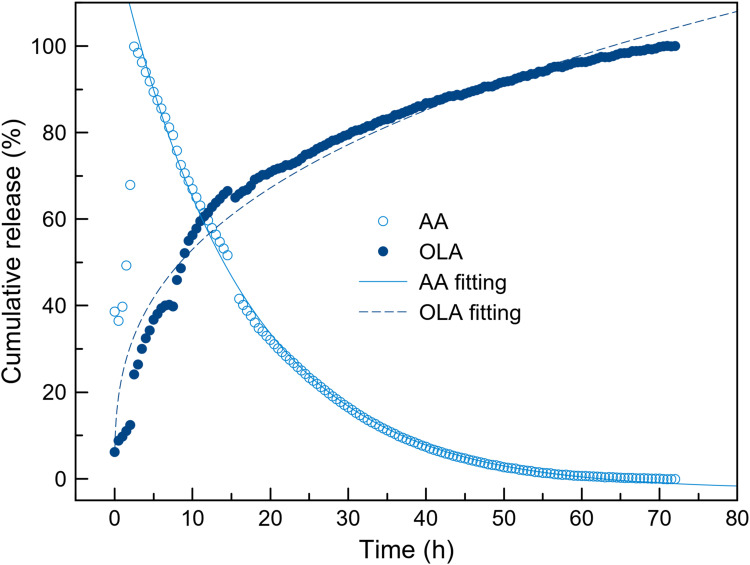
Figure 4.
Release kinetics of OLA and AA from the NPs. Cumulative release (%) of OLA (solid symbols) and AA (empty symbols) from NP-ACP-OLA-AA in PBS media. AA is degraded in solution once detached from the surface of the NPs. Dashed line represents the theoretical curves estimated according to Power law’s approximation (y(t)=a·tb), where the amount of drug in time (y(t)) depends on the effective diffusion constant a, time (t) and the drug release mechanism. Solid line represents the theoretical curves estimated according to an exponential decay of the drug: y(t)=exp(-t/τ), τ corresponds to half lifetime of the drug.

