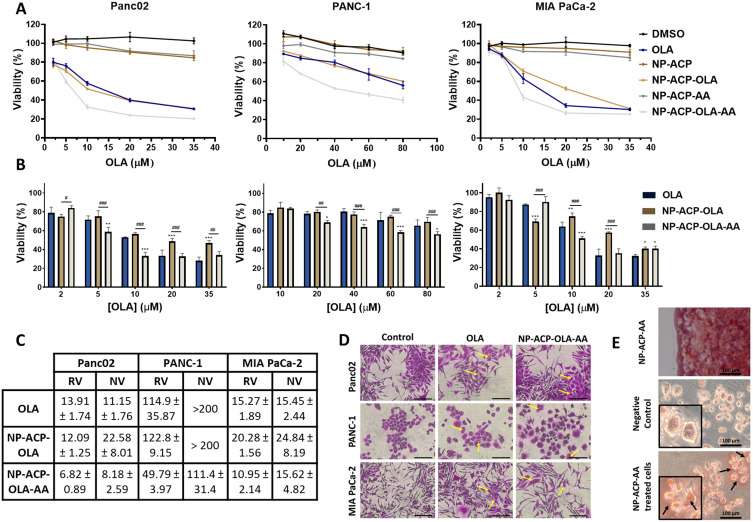
Figure 5.
Cell cytotoxicity of free and adsorbed OLA in different pancreatic adenocarcinoma cell lines. (A) Cell lines of pancreatic adenocarcinoma (Panc02, PANC-1, and MIA PaCa-2) were exposed to increasing concentrations of OLA, free or adsorbed on NPs. Cell viability of the corresponding controls (DMSO, NP-ACP and NP-ACP-AA) is also shown. (B) Graphical representation of the normalized proliferation values in cell lines treated with free OLA, NP-ACP-OLA and NP-ACP-OLA-AA after subtracting the effect of their controls: DMSO, NP-ACP and NP-ACP-AA, respectively. Data are represented as the mean ± SD (n=3). *p ≤ 0.05, **p ≤ 0.01, ***p ≤ 0.001; #Were used to indicate the significant differences in cell viability between NP-ACP-OLA and NP-ACP-OLA-AA groups. #p ≤ 0.05, ##p ≤ 0.01, ###p ≤ 0.001. (C) IC50 values (in µM) obtained in the cell lines after being treated with OLA, NP-ACP-OLA, and NP-ACP-OLA-AA. The real value (RV) and the normalized value (NV) represents, respectively, the IC50 without or with subtraction of the control toxicities. (D) Optical micrographs of cells treated with OLA or NP-ACP-OLA-AA, showing cell enlargement compared to the control. Scale bar = 100 nm. (E) Optical micrograph of a drop containing red-stained nanoparticles (NP-ACP-AA) and micrographs of PANC-1 cells without treatment or treated with NP-ACP-AA for 24 hours and then stained with alizarin red. Scale bar = 100 nm. Pictures were collected with a 20X objective.

