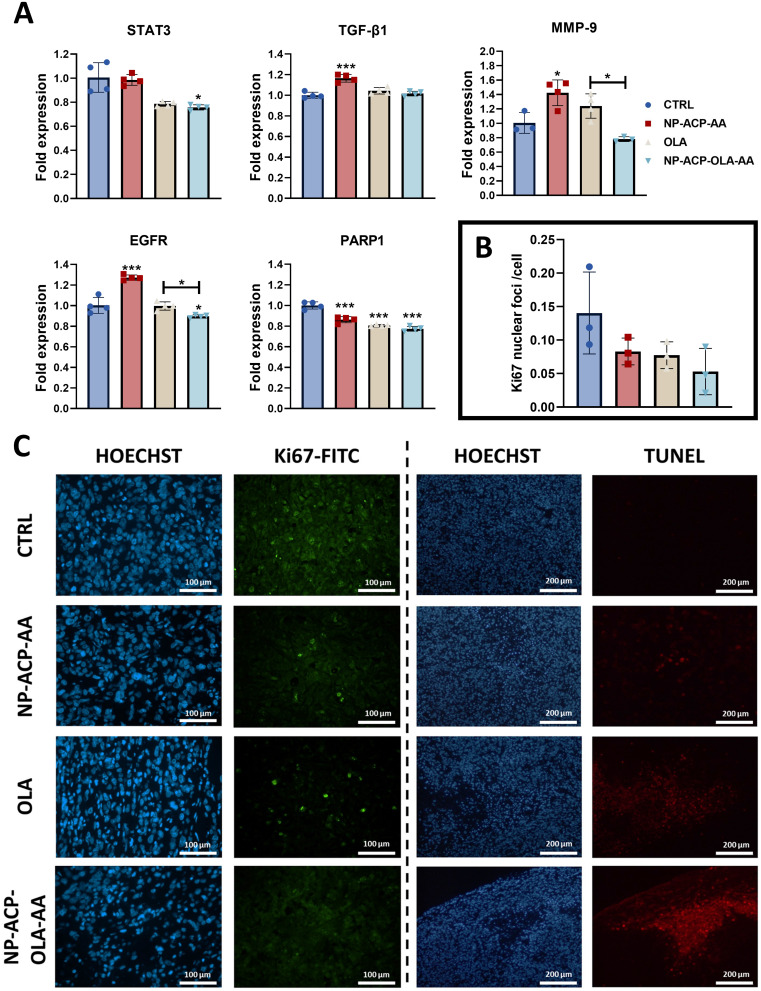
Figure 8.
Histological and gene expression analysis of excised tumors. (A) Gene expression analysis of cellular malignancy marker genes carried out by RT-qPCR in tumors derived from the experimental groups tested. All the data are represented as mean ± S.D (n=3). *p ≤ 0.05, **p ≤ 0.01 and ***p ≤ 0.001 compared to the control. Significant differences between different groups have been pointed out. (B) Quantification of protein expression of the proliferation marker Ki67 in tumors excised from mice of the different experimental groups and (C) images obtained after performing the Ki67 immunofluorescence experiment (green fluorescence) and a TUNEL experiment (red) for the detection of apoptosis in situ. Sections were counterstained with Hoechst (blue). Images were collected at 10X magnification. The scale bar is indicated in the corresponding images.

