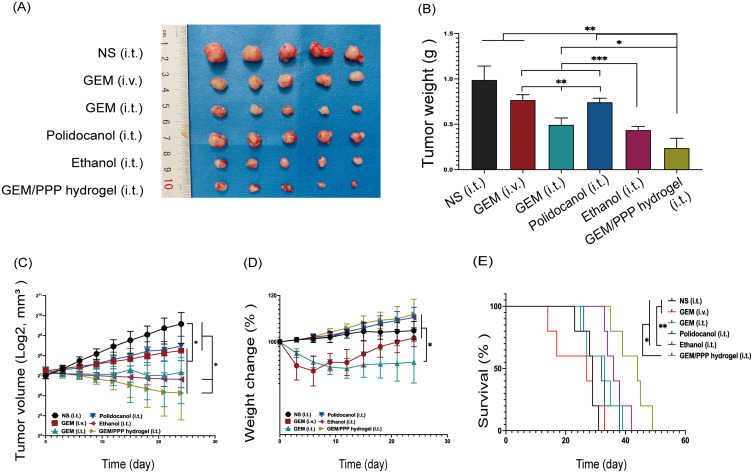
Figure 7.
The anti-tumor efficiency of different groups in vivo. (A) The photograph of excised tumors on day 25 post-treatment. (B) Tumor weight of excised tumors. A significant difference was observed in the Tamhane’s T2 test. (C) Tumor growth curves of the mice during treatments. A significant difference was observed in the median test. (D) Body weight changes curves of the mice during treatments. A significant difference was observed in the LSD post-hoc test. (E) Survival curves of mice in different groups. A significant difference was observed in the log-rank survival analysis. ***P < 0.001, **P < 0.01, *P < 0.05.

