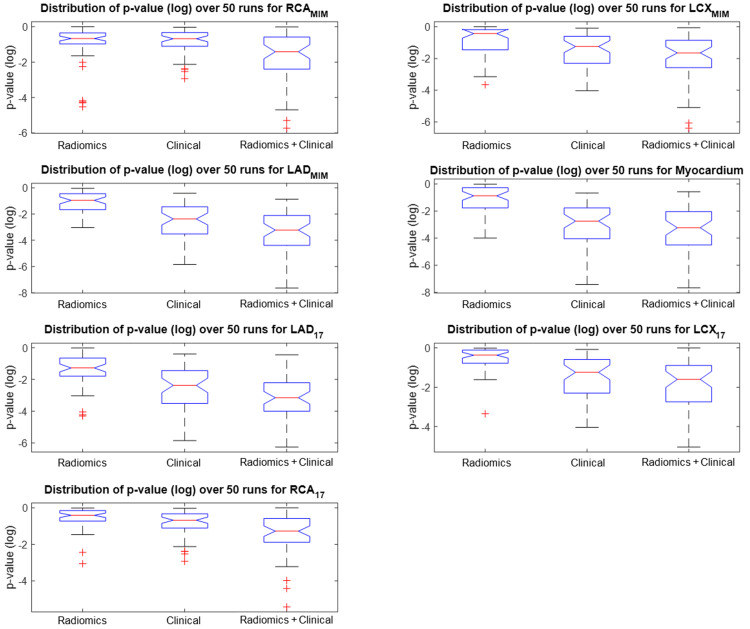
Figure 11. Distribution of p-values (log-scale) of the best fit out of 50 randomized trials.
Distribution of p-values (log-scale) of the best fit out of 50 randomized trials of stepwise linear regression for radiomics, clinical and combined features, and for all seven segmentations as defined in the Methods section (the lower, the better). Adding radiomics to clinical features is seen to enhance the regression significance across all segmentations.
LAD, left anterior descending; RCA, right coronary artery; LCX, left circumflex artery.

