
Fig. 4 |. StandardRat dataset description.
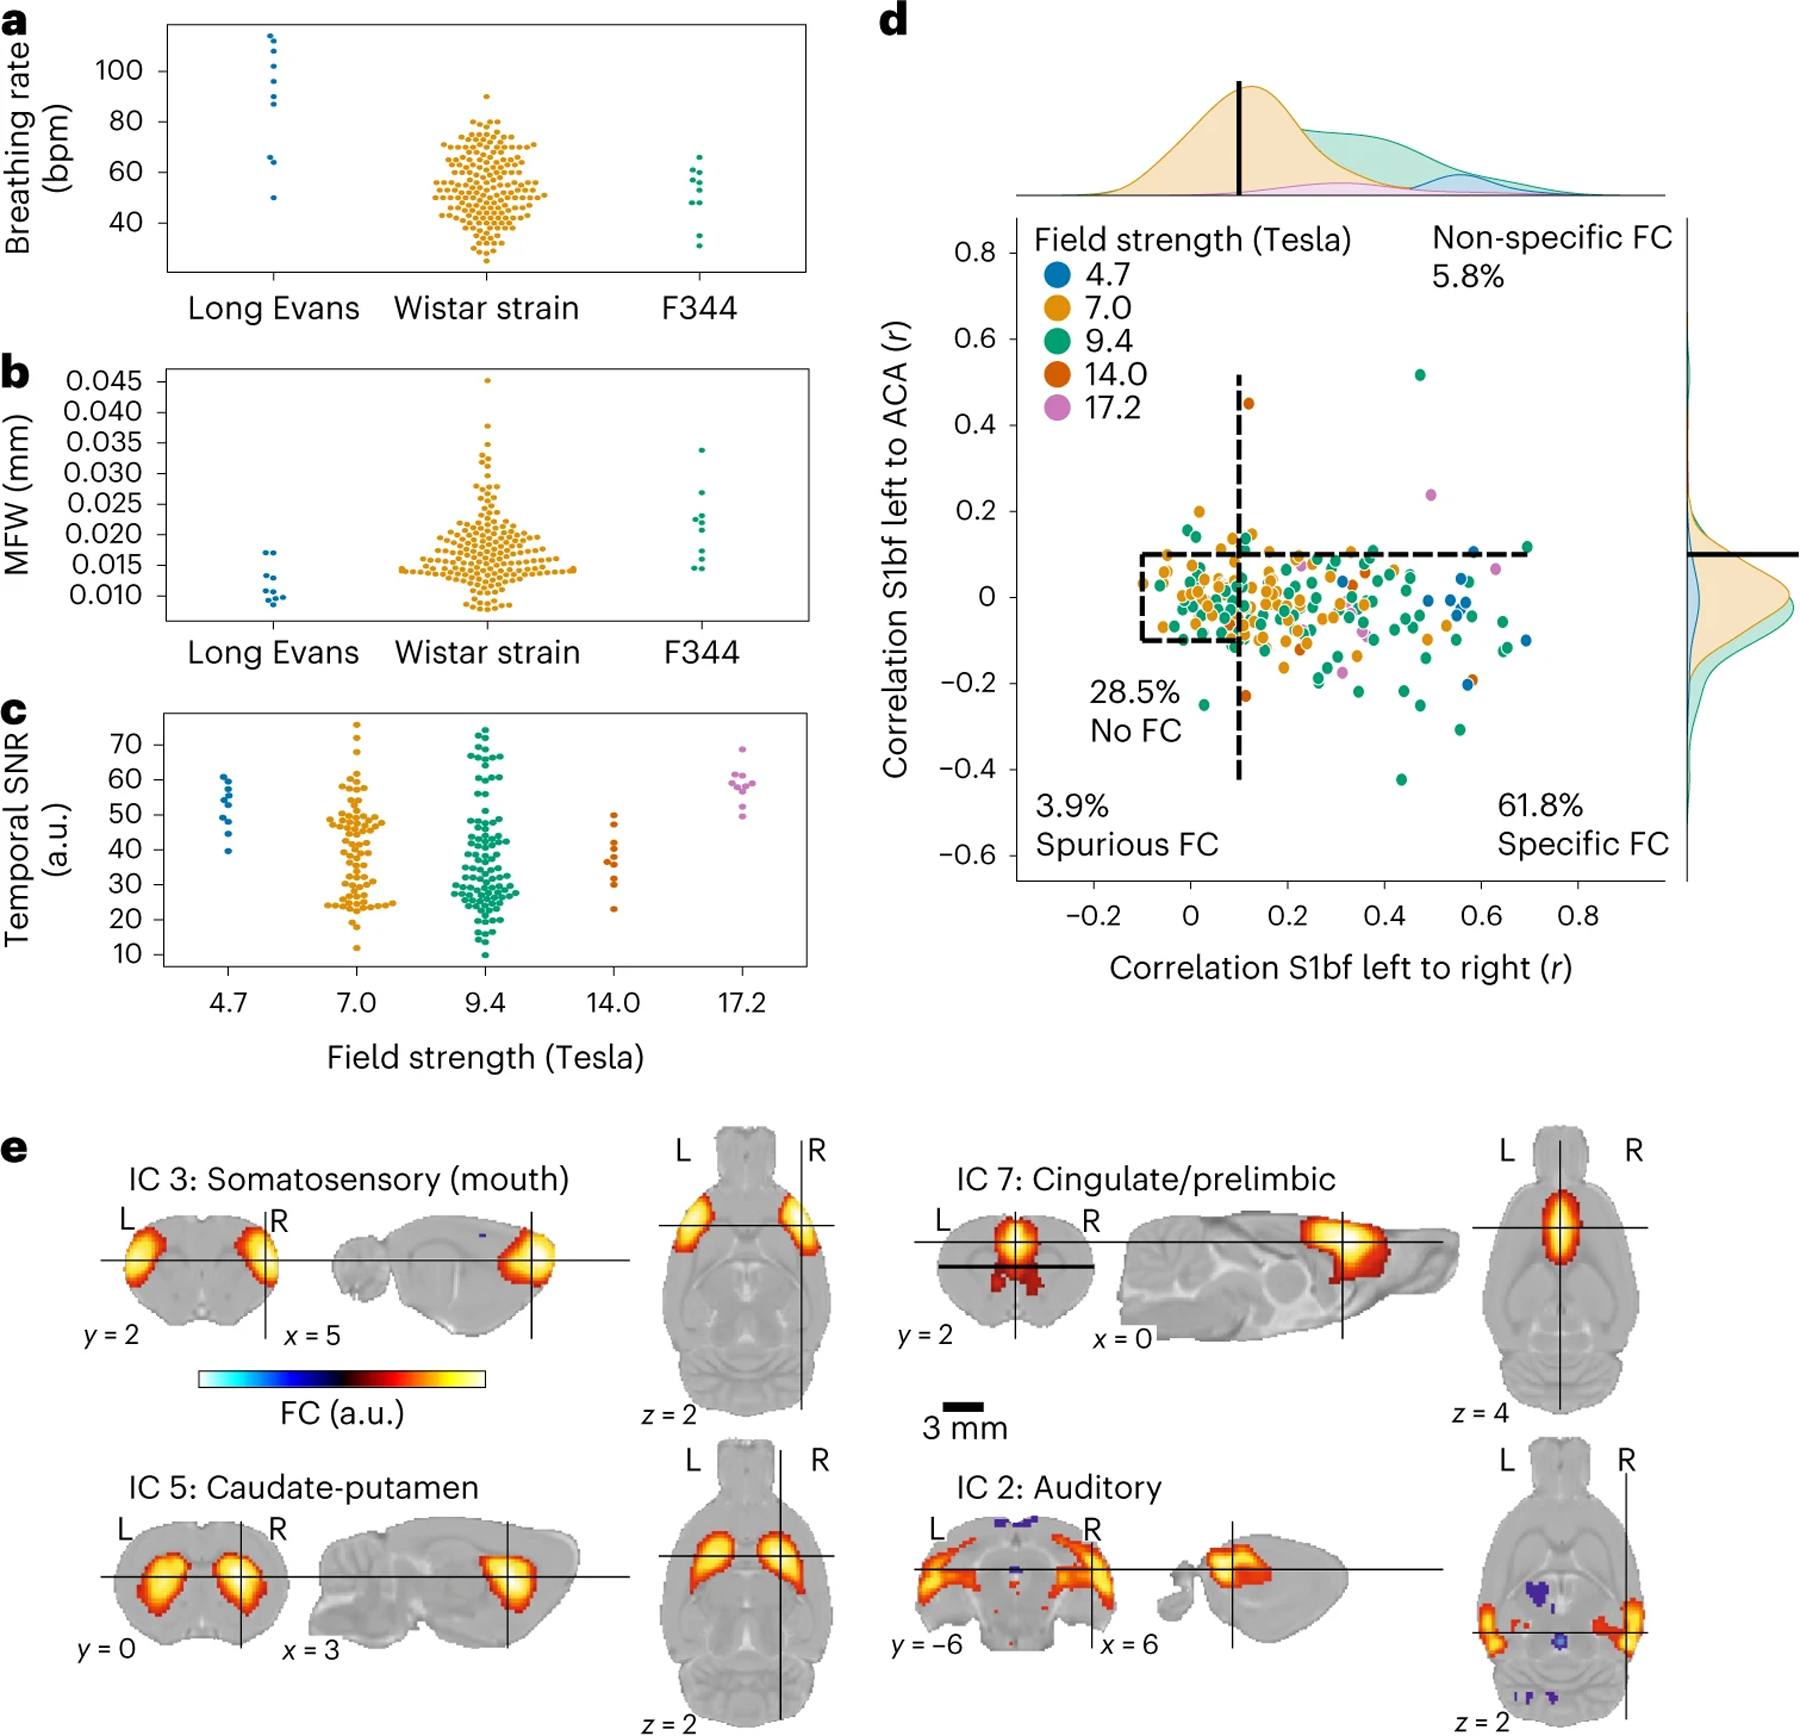
a, Breathing rate (bpm) as a function of strain. b, MFW as a function of strain. c, Temporal signal-to-noise ratio in the sensory cortex as a function of field strength. d, FC in left S1bf relative to specific (right S1bf) and non-specific (ACA) regions of interest using the global regression correction model. Dots represent scans (n = 207 rats); dotted lines indicate the thresholds used to delineate the categories. e, Representative independent components. a.u., arbitrary units.