Fig. 1.
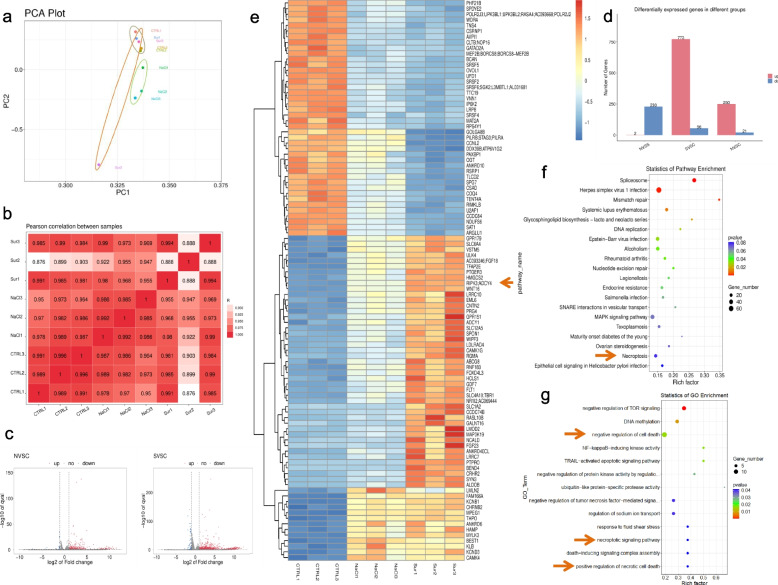
Necroptosis-related signaling pathway was activated in high-salt- or sucrose- incubated human epithelial cell. a PCA plots of high-salt and high-sucrose treated cells. Three sample of each group were showed here. b Pearson correlation between all samples, CTRL represented control group; NaCl represented high-salt group; Sur represent high-sucrose group. c Volcano maps showed different expression genes (DEGs) between N vs C and S vs C. Blue plots represented down-regulated genes and red plots represented up-regulated genes. d Histogram showed the number of DEGs between two groups. e Heat map showed top 100 DEGs among three groups. Arrows showed RIPK3 was up-regulated in both high-salt/sucrose incubated cells. f KEGG enrichment of DEGs. g. GO analysis of DEGs. Arrows showed necroptosis-related signaling pathways were activated here

