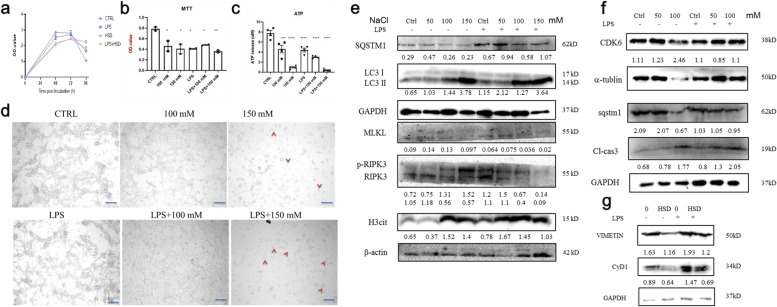
Fig. 3.
LPS pre-treatment enhanced HSD-induced cell death. a CCK8 analysis of CT26 growth curve. CT26 were treated by HSD (150 mM), LPS (100 ng/ul), LPS + HSD. b MTT assay showed LPS plus HSD treatment enhanced cell death in vitro. c ATP release assay of CT26 under different treatment. d Represent pictures of CT26 cell treated with HSD and/or LPS. e–g Western blotting analysis of CT26 cells under different treatments. * p < 0.05;** p < 0.01;*** p < 0.001; ****p < 0.0001

