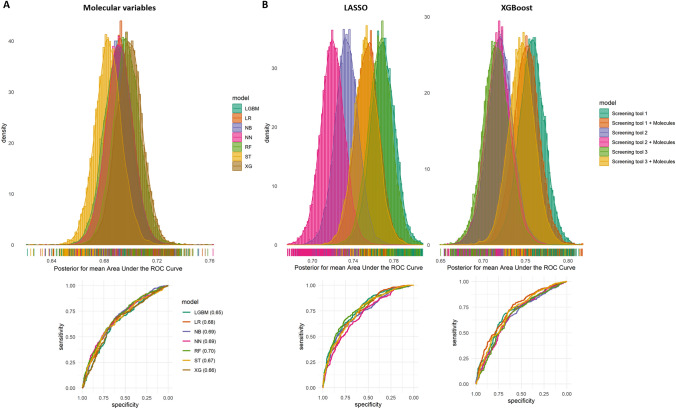
Figure 6.
Machine learning classification of sepsis and non-sepsis patients in the prediction cohort. Upper sections show the distributions of posteriors for mean area under the curve (AUC) from the nests in nested cross-validation and lower sections show the averaged ROC curve (AUCs within parenthesis in 6A). (A) Distributions of posteriors for mean AUCs and averaged ROC curve from nested cross-validations with seven different algorithms trained on molecular variables alone. (B) Distributions of posteriors for mean AUCs and averaged ROC curve from nested cross-validations trained on screening tools variables with or without molecular variables and their interactions. LR Penalized regularized logistic regressions (LASSO), RF Random forests, XG XGBoosted trees, NN Neural network, NB Naïve Bayes, LGBM lightGBM, ST Stacked model of LR, XG and NN.

