
FIGURE 5.
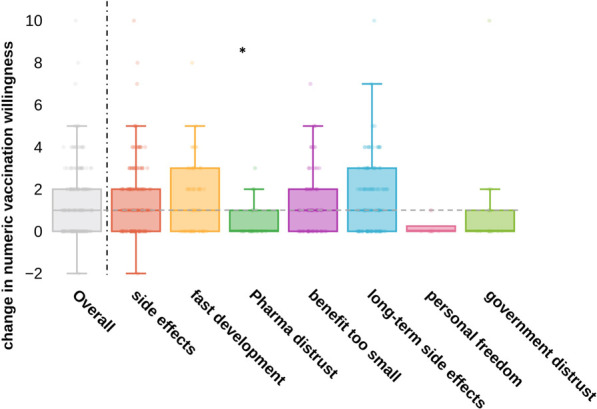
“Change in numeric vaccination willingness grouped by motives of vaccination hesitancy” change in vaccination willingness was generated by calculating the difference of subjective vaccination score before and after the seminar; vertical 551 line divides overall results from results grouped by motives of vaccination hesitancy; selection of multiple motives of vaccination hesitancy per person was enabled; horizontal line indicates overall median change; statistical significance was calculated using unpaired t-test to compare numeric change in vaccination willingness of each group to the remainders; the only statistical significance was found for distrust in the pharmaceutical industry, p-value 0.0018 (Austria, 2021).