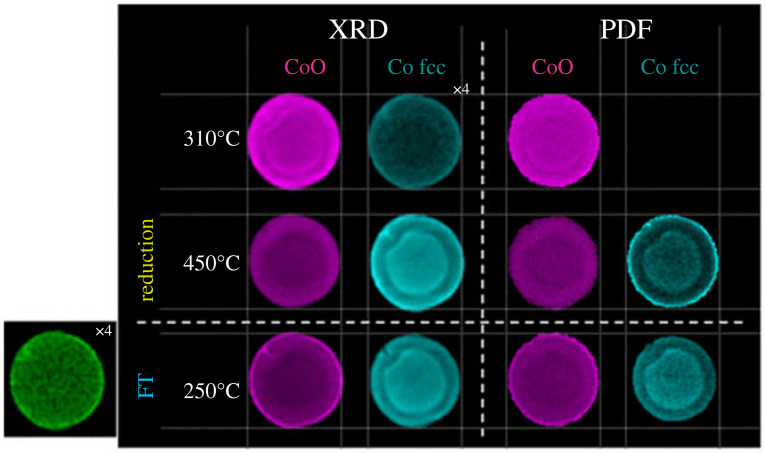
Figure 3.
PDF-CT exemplar in Fischer–Tropsch catalyst. Reconstructed two-dimensional integrated Fourier transform intensity maps based on the intensity of the Co–Co scattering features at approximately 3 Å (CoO) and 2.5 Å fcc Co are shown under reduction and during FT conditions as a function of temperature and time. Note corresponding XRD-CT data shown in the left panel. Reproduced from Senecal et al. [126].

