Figure 5.
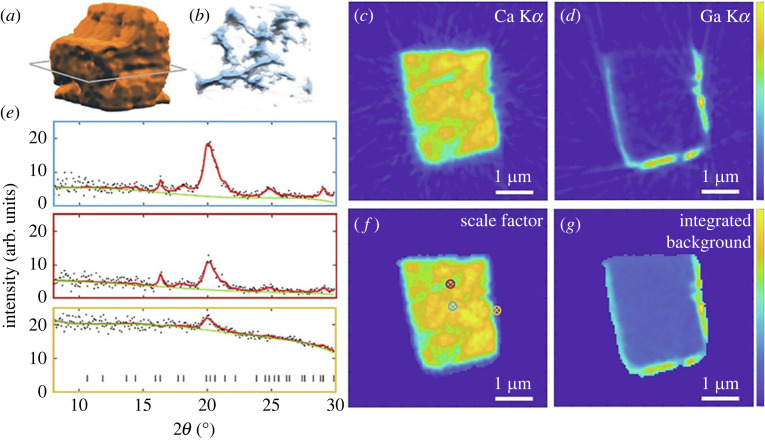
XRD-CT and XRF-CT reconstructions in cortical bone. Ca XRF-CT 3D renders in (a) and (b) and XRF-CT slices in (c) and (d). (e) Examples of reconstructed diffractograms originating from the points marked with circled crosses in f. (f) Rietveld scale factor (f) and integrated background (g). Reproduced from Palle et al. [148] with permission from Elsevier.

