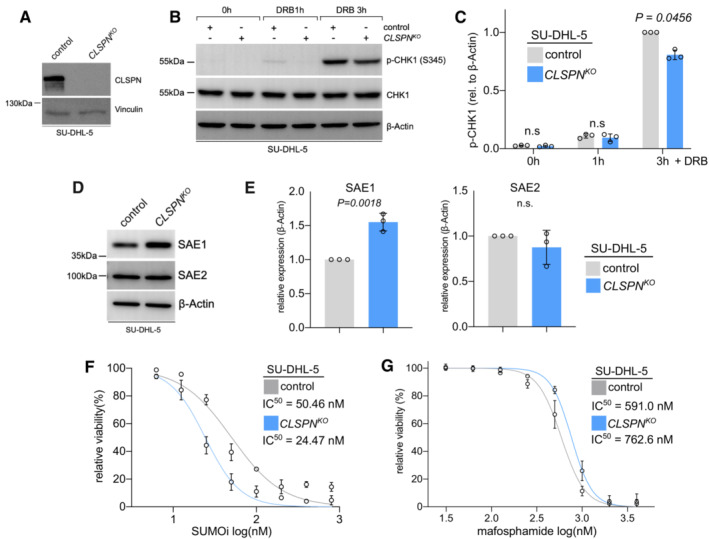
Figure 7. CLSPN loss results in effects similar to the effects of SLF2 loss.

- Immunoblot analysis of SU‐DHL‐5 cells following CRISPR/Cas9 mediated CLSPN knockout (KO) with the indicated antibodies.
- Immunoblot analysis of human SU‐DHL‐5 control and CLSPN KO cell lines upon DRB treatment (0.5 μM) for indicated time points with the indicated antibodies.
- Quantification of the p‐CHK1 western blots from (B). Protein expression of p‐CHK1 was normalized to β‐Actin protein expression. p‐CHK1 expression in control cells at 3 h of doxorubicin treatment was arbitrarily set to 1. Data are presented as mean ± SD of n = 3 independent experiments. P‐value determined by two‐way ANOVA; Šídák's multiple comparisons test.
- Immunoblot analysis of human SU‐DHL‐5 control and CLSPN KO cell lines with the indicated antibodies.
- Quantification of the SAE1 and SAE2 western blots from (E). Protein expression of SAE1 and SAE2 was normalized to β‐Actin protein expression. SAE1 and SAE2 expression in control cells were arbitrarily set to 1. Data are presented as mean ± SD of n = 3 independent experiments. P‐value determined by unpaired t‐test.
- SUMO inhibitor (SUMOi, TAK981; 0, 6.25, 12.5, 25, 50, 100, 200, 400, 800 nM) dose–response curves of CLSPN KO and control SU‐DHL‐5 cells. Cells were treated with increasing concentrations of SUMOi for 72 h and viability was determined by negative of DAPI staining and flow cytometry measurement. Error bars represent SD from three independent experiments.
- Mafosphamide dose–response curves of CLSPN KO and control SU‐DHL‐5 cells. Cells were treated with mafosphamide (MAF; 0, 31.25, 62.5, 125, 250, 500, 1,000, 2,000, 4,000 ng/ml) for 48 h and viability was determined by negative of DAPI staining and flow cytometry measurement. Error bars represent SD from three independent experiments.
Source data are available online for this figure.
