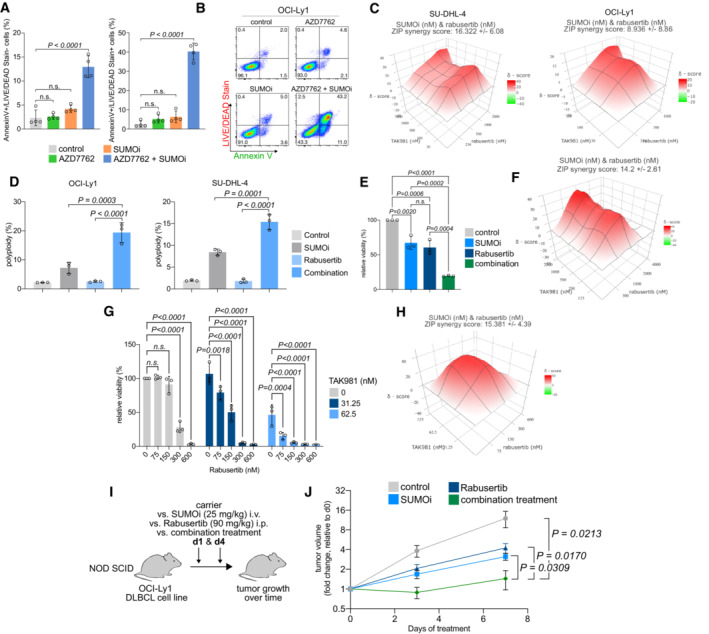
Quantification of flow cytometry results for LIVE/DEAD® Fixable Aqua Dead Cell Stain and Annexin V staining in human OCI‐Ly1 cells after SUMOi (15 nM) and AZD7762 (110 nM) co‐treatment for 72 h. P‐value was determined by ANOVA; Tukey's post hoc test. Error bars represent SD from three independent experiments.
Representative histograms of the flow cytometry experiment described in (A).
ZIP synergy score plot of human SU‐DHL‐4 and OCI‐Ly1 cells co‐treated with increasing concentrations of SUMOi and Rabusertib. The presented ZIP synergy scores are the average of n = 3 independent experiments.
Quantification of flow cytometry results for PI cell cycle analysis in human OCI‐Ly1 (SUMOi, 15 nM; Rabusertib, 200 nM) and SU‐DHL‐4 (SUMOi, 30 nM; Rabusertib, 500 nM) cells after co‐treatment with SUMOi and rabusertib treatment for 72 h. P‐value was determined by ANOVA; Tukey's post hoc test. Error bars represent SD from three independent experiments.
Quantification of cell viability measured by celltiterGlo from murine Eμ‐Myc lymphoma‐derived cell line co‐treated with SUMOi (500 nM) and Rabusertib (1,000 nM) for 72 h. Bar plots represent cell viability relative to the DMSO‐treated control cells. Error bars represent SD from three independent experiments. P‐value was determined by ANOVA; Tukey's post hoc test.
ZIP synergy score plot of primary murine Eμ‐Myc lymphoma cell line co‐treated with increasing concentrations of SUMOi and Rabusertib for 72 h. The presented ZIP synergy scores are the average of n = 3 independent experiments.
Quantification of cell viability measured by celltiterGlo from primary murine Eμ‐Myc lymphoma‐derived cells co‐treated with indicated concentrations of SUMOi and Rabusertib for 72 h. Bar plots represent cell viability relative to the DMSO‐treated control cells. Error bars represent SD from three independent experiments. P‐value was determined by ANOVA test; Tukey's post hoc test.
ZIP synergy score plot of primary murine Eμ‐Myc lymphoma cells co‐treated with increasing concentrations of SUMOi and Rabusertib for 72 h. The presented ZIP synergy scores are the average of n = 3 independent experiments.
The human DLBCL cell line OCI‐Ly1 was used to generate murine xenograft models in NOD SCID mice. Mice were treated with vehicle, 25 mg/kg SUMOi (TAK‐981), 90 mg/kg Rabusertib or the combination of SUMOi and Rabusertib on days 1 and 4.
Tumor size was measured over time (n = 4 mice in each group). Error bars represent SEM. P‐value determined by unpaired t‐test.