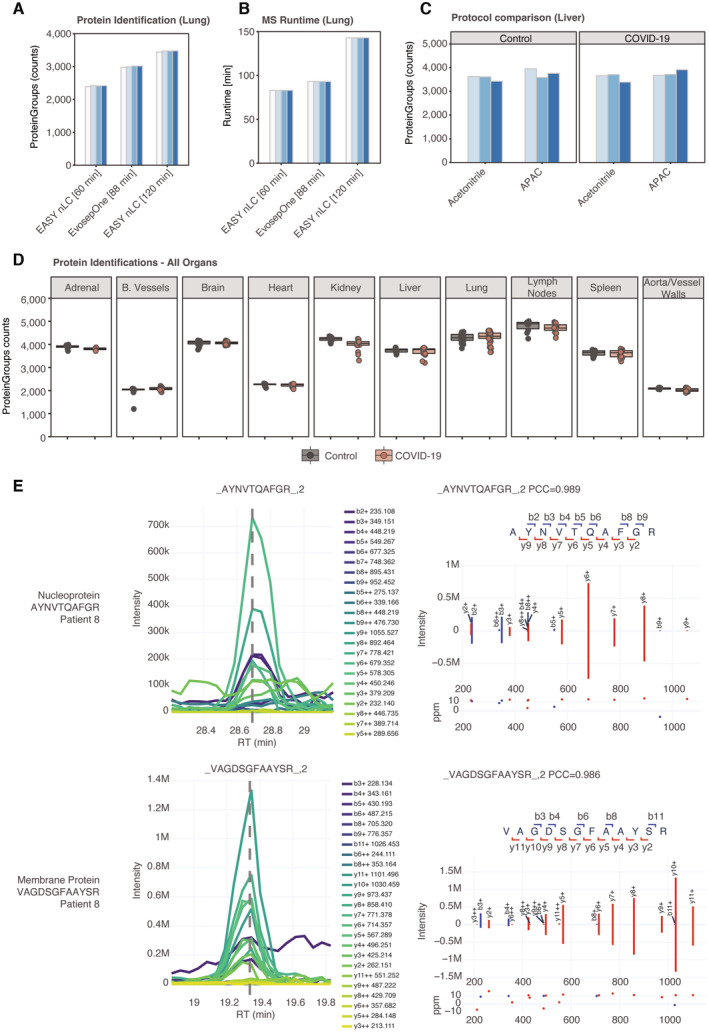
Figure EV1. Mass spectrometry quality control.

- Comparison of protein identification in lung tissue of the COVID‐19 cohort between the standardized 88 min gradient on Evosep One and a 60 or 120 min gradient on the EASY nanoLC system, respectively. Bars represent tissue samples of different patients and were grouped by the employed LC system, respectively.
- MS runtime of the comparison depicted in (B).
- Evaluation of our workflow for streamlined deparaffinization and lysis (APAC) and our previous state‐of‐art protocol for the processing of deparaffinized FFPE tissue in a 96‐well format (Coscia et al, 2020). Each bar depicts tissue samples of different patients while being grouped by the tested workflow, respectively.
- Counts of quantified protein groups in COVID‐19 samples and corresponding control groups in all organs using direct DIA data processing (not using a separately acquired DDA library). Each data point depicts a patient‐derived sample as indicated in Table EV1.
- Extracted ion chromatograms and prediction of fragment intensities for two examples of SARS‐CoV‐2 peptides in the directDIA acquisition mode of the lungs. For both peptides, the same patient was selected to represent the cohort.
