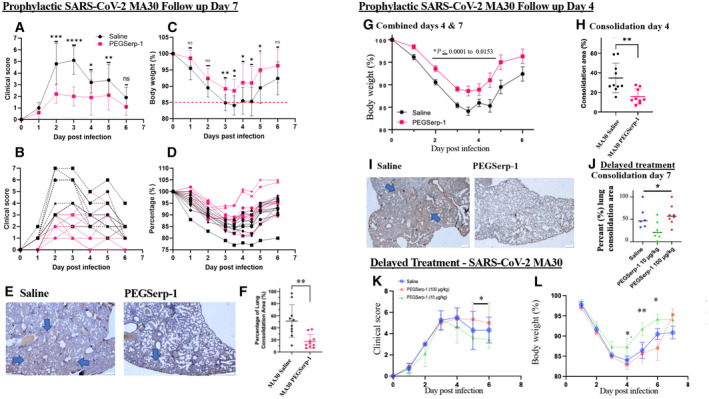
Figure 2. PEGSerp‐1 treatment improves clinical score and weight gain and reduces lung consolidation in SARS‐CoV‐2‐infected C57Bl/6 mouse models.

-
A–DSARSCoV‐2 MA30 infection in C57BL/6 mice 7 days follow‐up. PEGSerp‐1 treatment significantly improved mean (A) and individual (B) clinical scores (P < 0.045 to 0.0001, days 2–5) as well as mean (C) and individual weights (D) (P < 0.0481–0.0085, days 3–5; N = 20 mice, A, C mean ± SD).
-
EMicrographs illustrate lung consolidation in saline and PEGSerp‐1‐treated lungs. Large blue arrows indicate areas of consolidation in H&E‐stained lung sections (Mag 2×).
-
FGraph of (F) mean consolidation area divided by total lung area analyzed at 7 days follow‐up demonstrates reduced lung consolidation (P < 0.0018). PEGSerp‐1 treatment significantly improved weight gain during the second 4 day follow‐up study. (N = 20 mice, mean ± SE)
-
G, HCombined weights for the 4‐ and 7‐day follow‐up studies demonstrate consistently improved mean weights (G; P < 0.0153–0.0001) and reduced lung consolidation (H; P < 0.0033) with PEGSerp‐1 treatments in MA30‐infected mice. (N = 39mice, mean ± SD)
-
IMicrographs illustrate lung consolidation divided by total section analyzed in saline and PEGSerp‐1‐treated MA30‐infected mice at 4 days follow‐up. (Red—PEGSerp‐1, Black—saline) Large blue arrows indicate areas of consolidation in H&E‐stained lung sections (Mag 2×).
-
J–LPEGSerp‐1 delayed treatment at 10 ng/gm starting 2 days after infection reduced lung consolidation (J; P < 0.0403), clinical scores (K, combined data days 5 and 6, P < 0.05), and weight loss (L; P < 0.001–0.05). (N = 24 mice, mean ± SE)
Data analysis information: Mean ± SD (A, C, Mean ± SE (H, J, K, L); *P < 0.05, **P < 0.01, ***P < 0.001, ****P < 0.0001; (A–D, F) Unpaired t‐tests; (J) ANOVA indicated by line at top with subgroup analyses in brackets below; Prophylactic treatment (A–D) and (F); black—saline, red—PEGSerp‐1 treatments. (J–L) Blue—saline, green and blue—PEGSerp‐1.
Source data are available online for this figure.
