
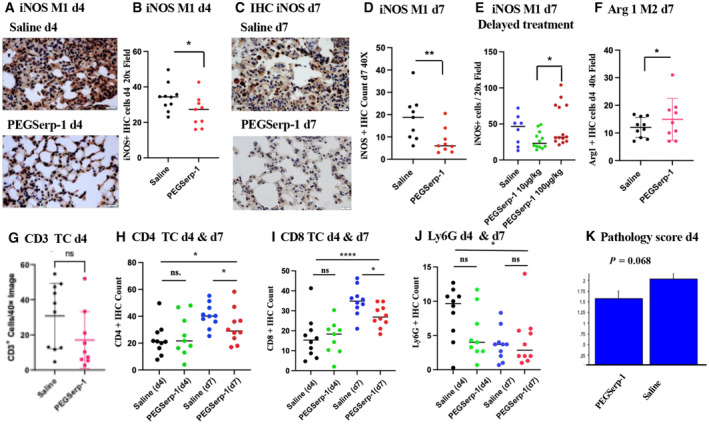
Figure 3. PEGSerp‐1 treatment significantly reduced immune cell infiltrates in SARS‐CoV‐2 MA30‐infected C57BL/6 mouse models at 4 and 7 days follow‐up (N = 39 mice).
-
A, BMicrographs illustrating iNOS‐positive M1 macrophage cell infiltrates on IHC‐stained lung sections in saline and PEGSerp‐1 (A)‐treated mice with significantly reduced IHC‐positive cell counts at 4 days follow‐up after PEGSerp‐1 prophylactic treatment (B; *P < 0.045). IHC‐stained lung sections (Mag 40×).
-
C, DiNOS‐positive infiltrates in IHC‐stained lung sections with saline or PEGSerp‐1 (C) treatment with significantly reduced IHC‐positive cell counts at 7 days follow‐up with prophylactic PEGSerp‐1 treatment (D; **P < 0.0052). IHC‐stained lung sections (Mag 40×).
-
EDelayed PEGSerp‐1 10 ng/gm dose treatment given 2 days after infection also reduced iNOS‐positive cell counts (*P < 0.0368).
-
FArginase1‐positive M2 macrophage IHC cell counts demonstrate a trend toward an increase at 4 days (P = 0.2921) and a significant increase at 7 days (*P < 0.0414) with PEGSerp‐1 treatment.
-
GCD3+ T cell counts were not significantly altered at 4 days (P = 0.1058).
-
HCD4+ T cell counts are not reduced at 4 days (P = 0.5031) but are reduced at 7 days (*P < 0.0454) with PEGSerp‐1 treatments.
-
ICD8‐positive T cell counts on IHC‐stained sections have a trend toward an increase at 4 days (P = 0.1503) and a significant reduction at 7 days (*P < 0.0303) with PEG Serp‐1 treatments.
-
JIHC for neutrophil marker Ly6G did not detect significant changes in PEGSerp‐1 treatment at days 4 (P = 0.0860) and 7 (P = 0.6570).
-
KIndependent blinded pathology score indicates a nonsignificant trend toward reduced inflammation at 4 days follow‐up (P = 0.068).
Data information: Mean ± SE; *P < 0.05, **P < 0.01, ***P < 0.001, ****P < 0.0001; ANOVA indicated by line at top with subgroup analyses in brackets below; back and blue circles—saline, red and green circles—PEGSerp‐1 treatments.
Source data are available online for this figure.