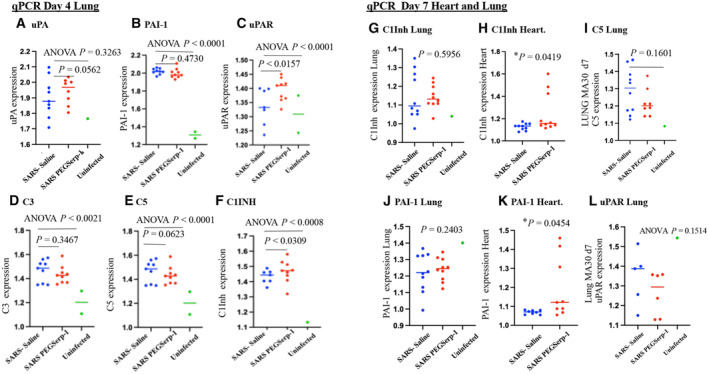
Figure 9. Gene expression—qPCR uPA/uPAR and complement pathways. Relative changes in gene expression for SARS‐CoV‐2 infections and associated modulation in coagulation and immune responses are increased after SARS‐CoV‐2 MA30 infection in lung and heart tissues (SARSCoV‐2 MA30 infection—N = 18 mice 4 days follow‐up; N = 20 mice 7 days follow‐up; Uninfected mice—N = 2). PEGSerp‐1 treatment significantly modified gene expression for uPAR and complement pathways.

-
A–CGene expression for PEGserp‐1 targets are increased after infection and modified by PEGSerp‐1 treatments. uPA (A; P = 0.3263), PAI‐1 (B; P < 0.0001), and uPAR (C; P < 0.0001) were increased in infected mouse lung extracts at 4 days follow‐up when compared to uninfected lungs with SARS‐CoV‐2 MA30 infection. PEG Serp‐1 treatment produced a significant increase in uPAR (C; P < 0.0157).
-
D–FComplement pathway genes‐encoding C3 (D; P < 0.0021), C5 (E; P < 0.001), and C1Inh (F; P < 0.0008) were also significantly increased with infection. PEG Serp‐1 treatment produced a borderline decrease in C5 (E; P = 0.0623) and a significant increase in C1Inh (F; P < 0.0309).
-
G–IAt 7‐day follow‐up, relative gene expression is no longer increased for C1Inh with PEGSerp‐1 treatment in MA30‐infected mouse lungs (G; P = 0.5956), but C1Inh was significantly increased in myocardial extracts with PEGSerp‐1 treatment at 7 days (H; P < 0.0419). C5 was not significantly increased with infection (I; P = 0.1601)
-
J–LPAI‐1 gene expression was not increased in lung extracts with PEGSerp‐1 treatment at 7 days follow‐up in MA30‐infected mouse lungs (J; P = 0.2403), but PAI‐1 expression was significantly increased at 7 days follow‐up in heart extracts (K; P < 0.0454). uPAR was not significantly increased in lung extracts at 7 days follow‐up (P = 0.1514). A time course for gene expression illustrates a peak time for changes in C1Inh gene expression demonstrates greater changes at 4 days when compared to day 2 and day 15 (L).
Data information: N = 19 mice at 4 days follow‐up; N = 20 mice at 7 days follow‐up. ANOVA indicated by line at top with subgroup analyses below; infected mice—blue circles, saline; red circle, PEGSerp‐1 treatments; and green circle, uninfected mice).
Source data are available online for this figure.
