
Figure EV2. Molecular analysis of the TAZG197V mouse.
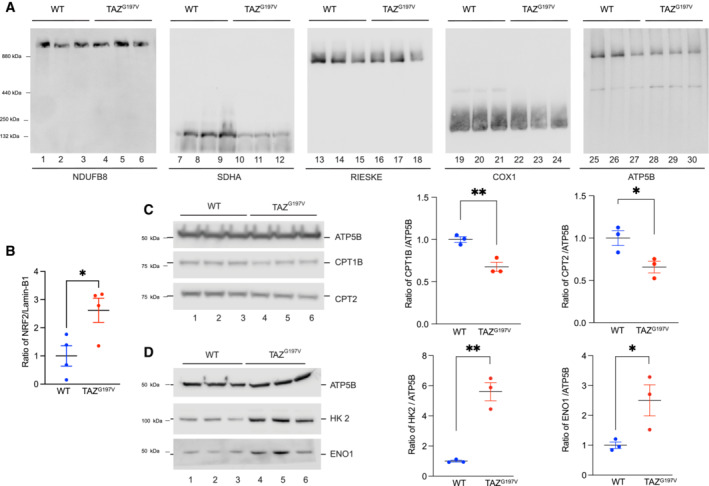
- BN‐PAGE analysis of heart mitochondria solubilized in 1% DDM (12‐week‐old mice).
- Quantification of NRF2 levels on Western blot normalized to Lamin‐B1. Mean ± SEM, n = 4, unpaired t‐test: *P < 0.05.
- Western blot analysis of isolated mouse heart (20‐week‐old mice) mitochondria (left) and quantification (right) of CPT1 and CPT2 protein levels normalized to ATP5B. Mean ± SEM, n = 3, unpaired t‐test: *P < 0.05, **P < 0.01.
- Western blot analysis as in a (left) and quantification of HK2 and ENO1 normalized to ATP5B. Mean ± SEM, n = 3, unpaired t‐test: *P < 0.05, **P < 0.01.