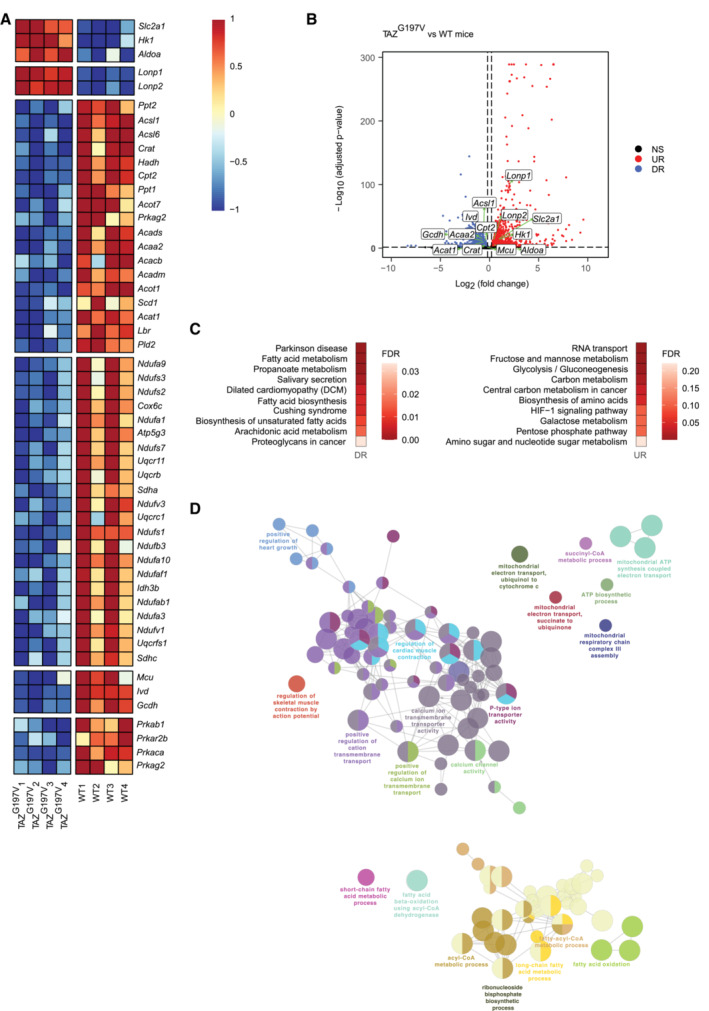
Figure 3. Gene expression profiling in TAZG197V mice heart.

- Heatmap representation of normalized expression (centered and scaled) of selected genes involved in biological pathways relevant for the study, in 14‐week‐old WT and TAZG197V mice.
- Volcano plot of differentially expressed genes between 14‐week‐old WT and TAZG197V mice. X‐axis denotes fold change in expression (log2 scale), y‐axis denotes adjusted P‐value (negative log10 scale) for the analyzed genes in the data (each dot represents one single gene). Blue and red dots represent genes significantly downregulated (DR) and upregulated (UR), respectively, in the TAZG197V mice compared to WT mice. The cut‐offs used were: adjusted P‐value < 0.05 and fold change > 1.15 or < −1.15. Non‐significant (NS) genes are depicted in black. Selected genes involved in pathways relevant for the study are labeled in the plot.
- (Left) Over‐representation analysis of selected significantly downregulated genes in 14‐week‐old TAZG197V mice and (right) over‐representation analysis of selected significantly upregulated genes (left) in TAZG197V mice. Functional pathways derived from KEGG database, top 10 over‐represented (enriched) pathways were selected for visualization. Color indicates the enrichment FDR value (Benjamini–Hochberg procedure).
- ClueGO network visualization of groups of enriched functional pathways (biological processes) for the selected significantly downregulated genes in TAZG197V mice. The most significant pathways/terms among a group of pathways are highlighted in the network. The size of the nodes indicates the number of genes from the given list involved in that pathway.
