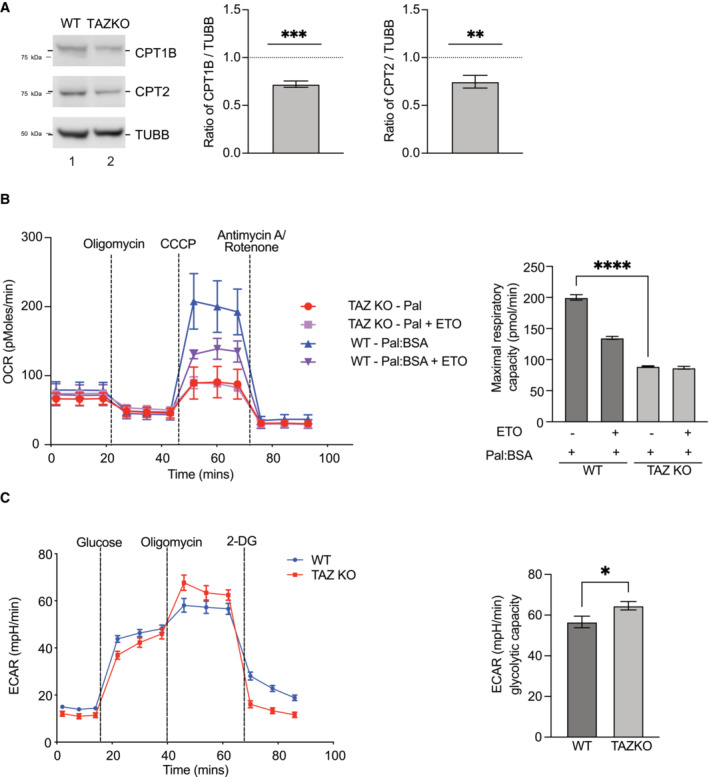
Figure EV3. TAZ‐deficient MEF cells display reduced fatty acid oxidation.

- Western blot analysis (left) and quantification (right) of CPT1 and CPT2 protein levels in WT and TAZKO MEF cell lysate normalized to β‐tubulin. Mean ± SEM, n = 4, unpaired t‐test: **P < 0.01, ***P < 0.001.
- Oxygen consumption rate of WT and TAZ MEF cells in media supplemented with palmitate‐BSA, basal, oligomycin, CCCP, and antimycin/rotenone treated (left). ETO, etomoxir. Quantification of maximal respiratory capacity (right). Mean ± SEM, n = 3, unpaired t‐test: ****P < 0.0001.
- Extracellular acidification rate, presentation of basal rate, addition of glucose, oligomycin, and 2 deoxyglucose (2‐DG). Quantification of Glycolysis and Glycolytic capacity of the cells is presented on the right. Mean ± SEM, n = 6, unpaired t‐test: *P < 0.05.
