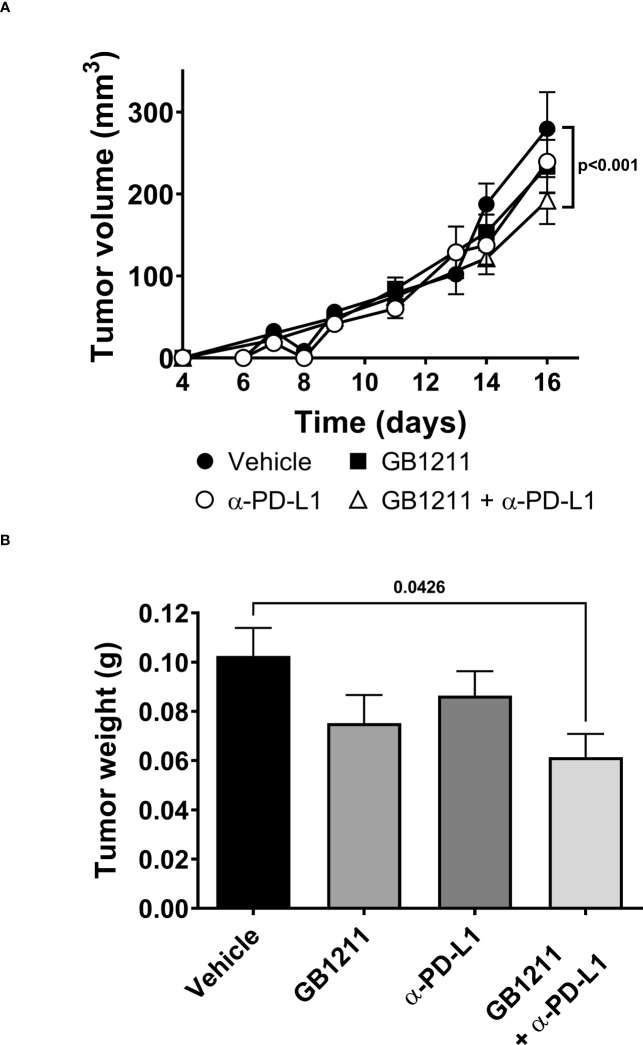
Figure 3.
LLC1 subcutaneous tumor (A) volumes and (B) weights. Results represent the mean ± SEM (vehicle n=28 tumors from n=16 mice, GB1211 (10 mg/kg) n=12 tumors from n=8 mice, anti-PD-L1 (200 µg) n=28 tumors from n=16 mice, GB1211 (10 mg/kg) + anti-PD-L1 (200 µg) n=14 tumors from n=8 mice). Two-way ANOVA with Tukey’s post-hoc test was used to test for differences in tumor volume with only significant changes shown. One-way ANOVA and Dunnett’s post-test were used to compare tumor weight with only significant changes shown.

