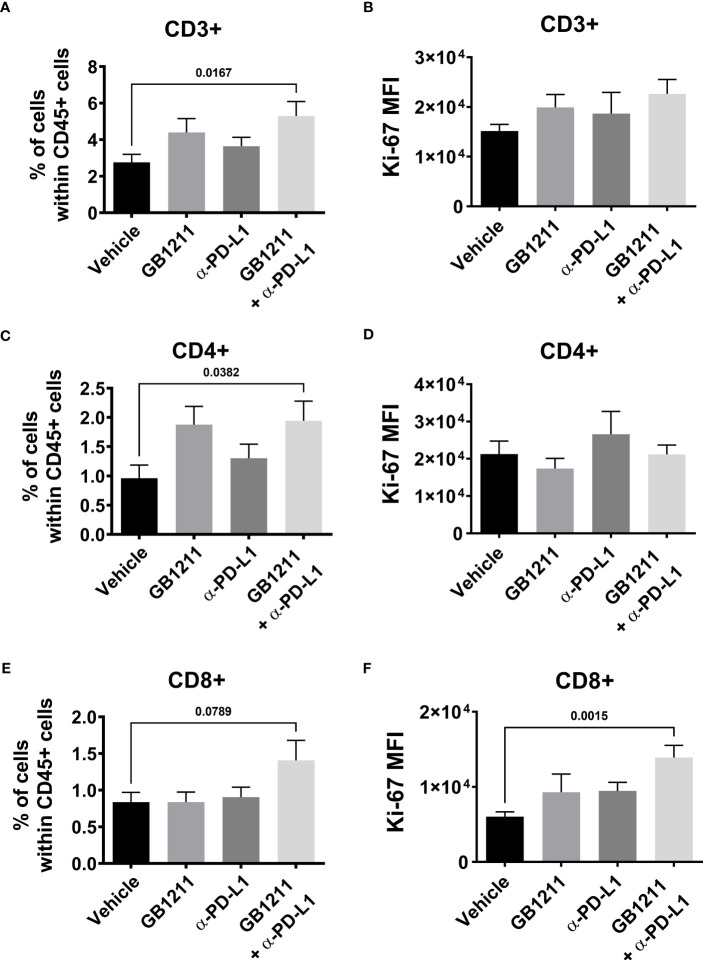
Figure 4.
post-hocLLC1 subcutaneous tumor digests were analysed for tumor infiltrating CD8+ T cell populations by flow cytometry. Frequency of (A) CD3+, (C) CD4+ and (E) CD8+ cells expressed as a % of the total immune (CD45+) population and Ki-67 expression as mean fluorescence intensity (MFI) in (B) CD3+, (D) CD4+ and (F) CD8+ T cells. Results are expressed as mean ± SEM (vehicle n=12, GB1211 n=10, anti-PD-L1 n=10, GB1211+anti-PD-L1 n=12). Analysed via one-way ANOVA with Dunnett’s post-test with only significant changes shown except for drug combination p-value shown in panel 4 (E).

