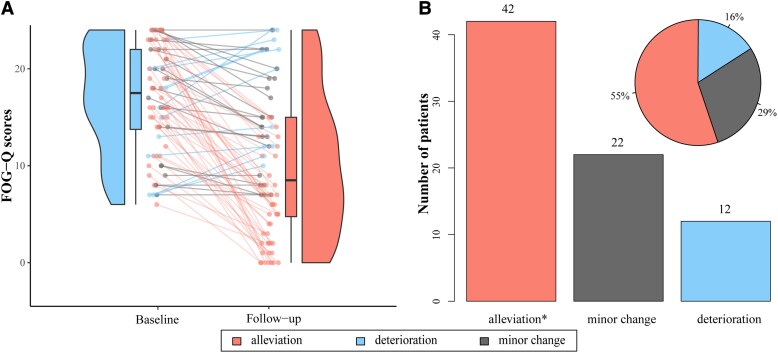
Figure 2.
Effects of high-frequency STN-DBS on FOG. (A) The FOG-Q scores at baseline (blue) and follow-up (salmon). The line charts illustrate individual FOG-Q changes: salmon = FOG alleviation (FOG-Q score drops by >30%), blue = FOG deterioration (FOG-Q score increases), grey = minor change (FOG-Q score drops by <30%), and the violin plots represent overall trends (P < 0.001). (B) Among 76 FOG patients after STN-DBS, the FOG symptoms of 42 patients were alleviated (salmon), 22 patients had minor changes and 12 patients deteriorated. *The FOG symptoms of 18 patients completely disappeared after DBS.

