Figure 5.
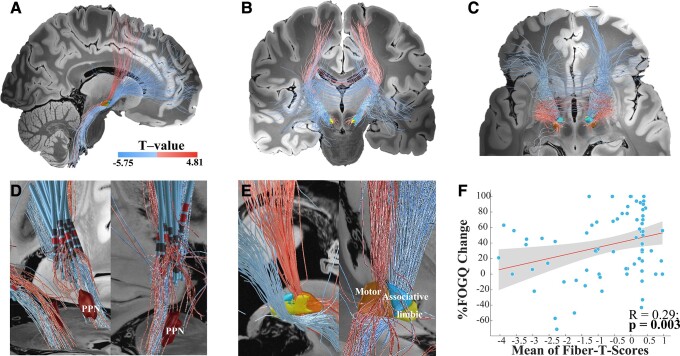
The predictive structural connectivity network model. Discriminative fibre tracts of positivity and negativity associated with the %FOG-Q changes are displayed from the sagittal (A), coronal (B) and axial (C) views. The top 30% predictive tracts are displayed. Tracts in white-to-red scale represent the T-values for the positive association between selected tracts and the FOG percent change, whereas the tracts in white-to-blue represent the T-values for the negative association. Tracts cross from the VTAs in the STN to the SMA/pre-SMA were positively associated with the %FOG-Q changes, and tracts connecting the VTAs in the STN to the PFC were negatively associated with the %FOG-Q changes. (D) Many positive tracts extend to the MLR, in particular the PPN. (E) The spatial positions with the STN of positive pathways are mainly crossing through the upper dorsal and centromedial portion of the STN, while negative pathways are most crossing though or surrounding the lower ventral and centromedial of STN. (F) Results from this analysis were validated in a LOOCV design (n = 76, Spearman R = 0.29; P = 0.003); 95% confidence intervals are represented by shaded areas.

