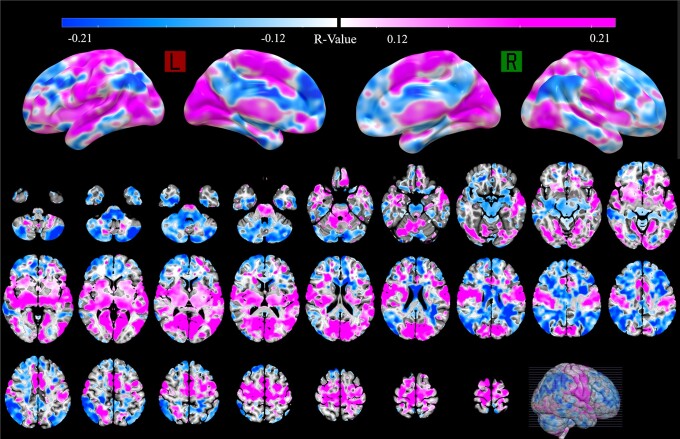
Figure 7.
Functional connectivity network results. Hot colours represent high positive correlations, and cold colours represent negative correlations with the %FOG-Q changes. The connectivity to SMA/pre-SMA, motor cortex, basal ganglia, MLR and occipital regions is strongly correlated with FOG alleviation, but connectivity to the prefrontal regions, cerebellum and cingulate gyrus is correlating with FOG deterioration.

