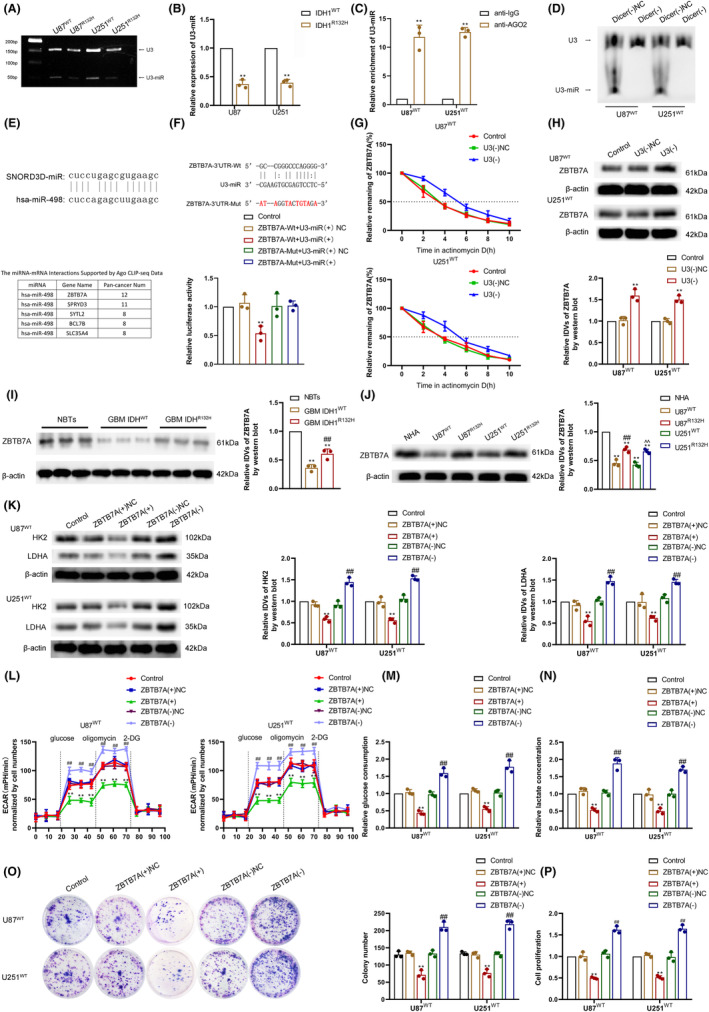
FIGURE 5.

ZBTB7A was downregulated in IDH1WT GBM via U3‐miR targeting of ZBTB7A 3′UTR, and overexpression of ZBTB7A inhibited IDH1WT GBM cell aerobic glycolysis and proliferation. (A) The existence of U3‐miR was detected in IDH1WT and IDH1R132H GBM cells via RT‐PCR. (B) The expression of U3‐miR was analyzed in IDH1WT and IDH1R132H GBM cells via qRT‐PCR. **p < 0.01 versus IDH1WT group. The data were statistically analyzed via the Student's t‐test. (C) U3‐miR binding to Ago2 was verified via an RNA immunoprecipitation (RIP) assay. **p < 0.01 versus anti‐IgG group. The data were statistically analyzed via the Student's t‐test. (D) The expression of U3 and U3‐miR was detected after Dicer knockdown via northern blot. (E) Schematic representation of the similarity in the sequence of U3‐miR and hsa‐miR‐498 (above). ZBTB7A was a potential target gene of U3‐miR predicted by StarBase database (below). (F) Relative luciferase activity was measured in HEK293T cells co‐transfected ZBTB7A 3′UTR‐Wt or Mut and U3‐miR. **p < 0.01 versus ZBTB7A‐Wt + U3‐miR(+)NC group. (G) ZBTB7A mRNA stability was measured after U3 knockdown in IDH1WT GBM cells treated with actinomycin D. **p < 0.01 versus U3(−) NC group. (H) ZBTB7A protein expression was detected after U3 knockdown via western blot. **p < 0.01 versus U3(−) NC group. (I) ZBTB7A protein expression was detected in NBTs, IDH1WT GBM tissues, and IDH1R132H GBM tissues via western blot. **p < 0.01 versus NBT group; ## p < 0.01 versus IDH1WT GBM group. (J) ZBTB7A protein expression was detected in NHA, IDH1WT, and IDH1R132H GBM cells via western blot. **p < 0.01 versus NHA group; ## p < 0.01 versus U87 IDH1WTgroup; ^^ p < 0.01 versus U251 IDH1WT group. (K) HK2 and LDHA protein expression were analyzed via western blot in ZBTB7A overexpression or knockdown IDH1WT GBM cells. (L) Aerobic glycolysis was measured via ECAR assay in ZBTB7A overexpression or knockdown IDH1WT GBM cells. (M) Glucose consumption was measured in ZBTB7A overexpression or knockdown IDH1WT GBM cells. (N) Lactate production was measured in ZBTB7A overexpression or knockdown IDH1WT GBM cells. (O) Proliferation ability was detected in ZBTB7A overexpression or knockdown IDH1WT GBM cells via colony formation assay. (P) Viability was detected in ZBTB7A overexpression or knockdown IDH1WT GBM cells via CCK‐8 assay. **p < 0.01 versus ZBTB7A(+)NC group; ## p < 0.01 versus ZBTB7A(−)NC group. Data are presented as the mean ± SD of three independent experiments per group, unless otherwise specified. The data were statistically analyzed via one‐way ANOVA.
