FIGURE 7.

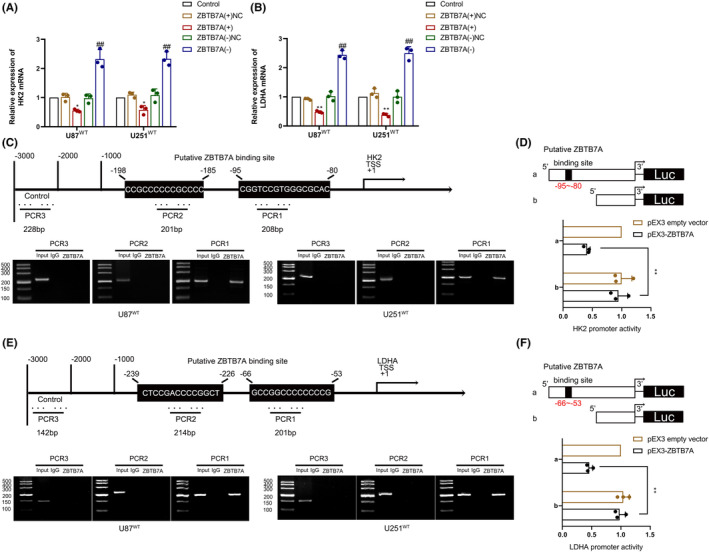
ZBTB7A transcriptionally regulated HK2 and LDHA expression. (A) HK2 mRNA expression was analyzed after ZBTB7A overexpression or knockdown via qRT‐PCR in IDH1WT GBM cells. (B) LDHA mRNA expression was analyzed after ZBTB7A overexpression or knockdown via qRT‐PCR in IDH1WT GBM cells. **p < 0.01 versus ZBTB7A(+)NC group; ## p < 0.01 versus ZBTB7A(−)NC group. (C) Diagram showing ZBTB7A binding site of HK2 promoter (above). Chromatin immunoprecipitation (ChIP) assay revealed ZBTB7A bound to the HK2 promoter (below). (D) Schematic diagram of luciferase reporter construction and relative luciferase activity analyzed in cells co‐transfected with pEX3‐ZBTB7A or empty vector and the HK2 promoter (−1000 to 0 bp) (or HK2 promoter without the putative ZBTB7A binding site). (E) Diagram showing ZBTB7A binding site of LDHA promoter (above). ChIP assay revealed ZBTB7A bound to the LDHA promoter (below). (F) Schematic diagram of luciferase reporter construction and relative luciferase activity analyzed in cells co‐transfected with pEX3‐ZBTB7A or empty vector and the LDHA promoter (−1000 to 0 bp) (or LDHA promoter without the putative ZBTB7A binding site). **p < 0.01 versus pEX3 empty vector group. Data are presented as the mean ± SD of three independent experiments per group, unless otherwise specified. The data were statistically analyzed via one‐way ANOVA.
