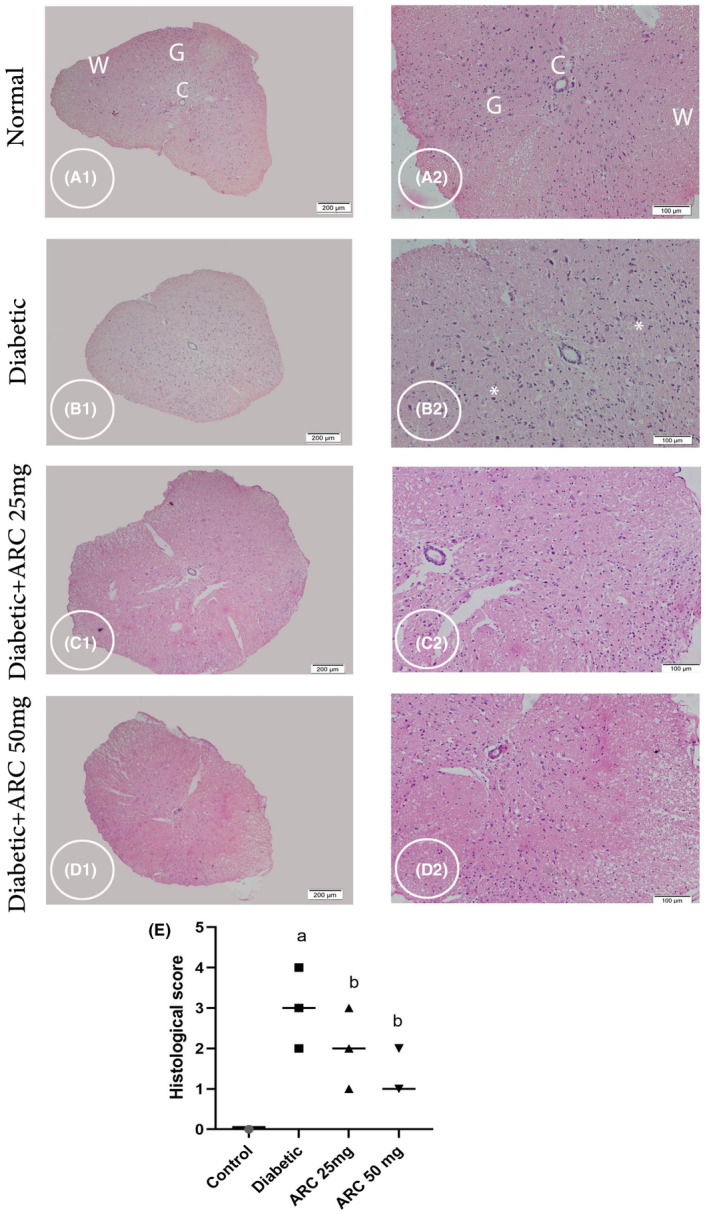
FIGURE 4.

Photomicrograph stained with H&E showing cross sections of thoracic region of the spinal cord (SC). Control group (A1 & A2) displaying normal neurons in the Gray matter (G); note central canal (C) and white matter (W). Diabetic group (B1& B2) displayed shrinkage of some neurons (*) (B2). Diabetic group treated with 25 mg/kg ARC (C1& C2) and diabetic group treated with 50 mg/kg ARC (D1 & D2) displayed an improvement in pathological changes with less shrinkage of neurons. A1, B1, C1, & D1 (scale bar 200 μm) & A2, B2, C2, & D2 higher magnification the gray matter (scale bar 100 μm).
