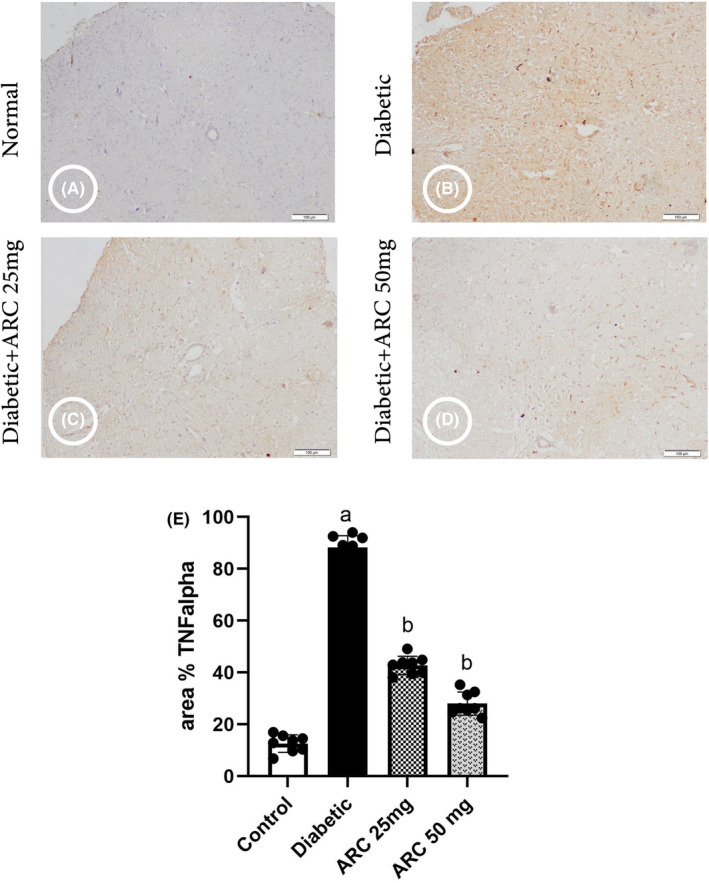
FIGURE 8.

Photomicrographs of the spinal cord immunostained with tumor necrosis factor alpha. (A) Control group, (B) diabetic group, (C) diabetic group treated with 25 mg/kg ARC, (D) diabetic group treated with 50 mg/kg ARC, and (E) mean of area % of immunoreaction in spinal cord immunostained with TNF alpha. Results were expressed as mean ± SD. Superscript symbols indicate a significant difference at p ≤ 0.05 using one‐way ANOVA followed by the Tukey's test for multiple comparisons. aSignificant differences from normal control. bSignificant differences from diabetic mice (Scale bar 100 μm).
