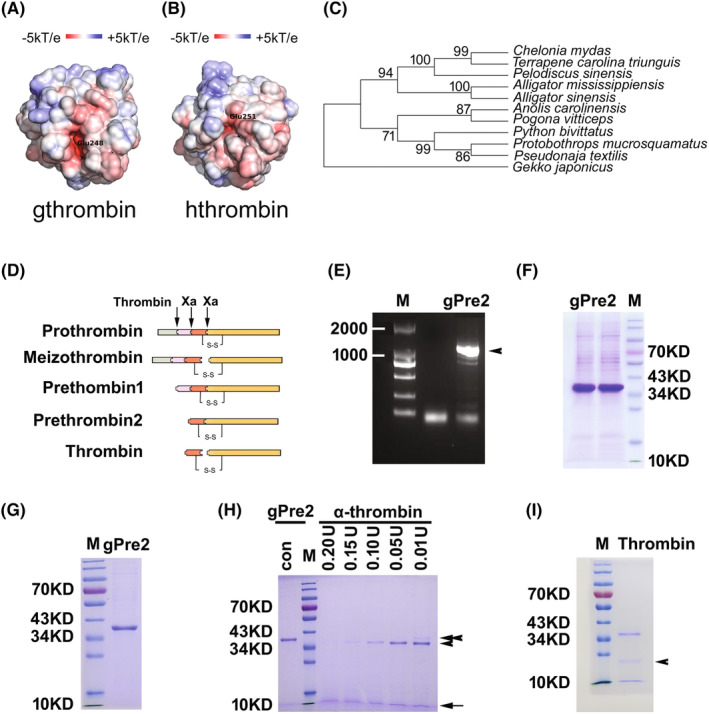
FIGURE 2.

Electrostatic potential and phylogenic analysis of gthrombin, and preparation of the recombinant protein. (A and B) Electrostatic potentials of gecko and human thrombin mapped on the solvent‐accessible surfaces. The red and blue regions represent negative and positive electrostatic potentials, respectively. (C) Phylogenetic tree of prethrombin‐2 sequences annotated from prothrombin of gecko and other representative reptiles constructed by the neighbor‐joining method within the package PHYLIP 3.5c. Bootstrap majority consensus values on 1000 replicates are indicated at each branch point in percent. Prothrombin sequences obtained from GenBank are Gekko japonicus (XP_015262498), Alligator mississippiensis (XP_006261451), Alligator sinensis (XP_006026972), Anolis carolinensis (XP_003214643), Chelonia mydas (XP_007069796), Pelodiscus sinensis (XP_006117365), Pogona vitticeps (XP_020654675), Protobothrops mucrosquamatus (XP_015679609), Pseudonaja textilis (XP_026563591), Python bivittatus (XP_007421832), and Terrapene carolina triunguis (XP_024070737). (D) Illustration of prothrombin activation. (E) Agarose gel electrophoresis of gecko prethrombin‐2 (gPre2). Arrowhead indicates the according bands of PCR products. (F) The recombinant gPre2 expressed by 293 T cells. (G) The purified recombinant gPre2. (H) 3 μg of gPre2 was subjected to activation by 0–0.20 U of Ecarin in the reaction buffer. Arrowhead indicates the size of B chain of gthrombin, while arrow indicates A chain. Tandem arrowhead indicates the size of gPre2. (I) The purified gthrombin. Arrowhead indicates an unidentified band, which was further analyzed by mass spectrometry to be a degradation product of gthrombin. M, Marker.
