
FIGURE 3.
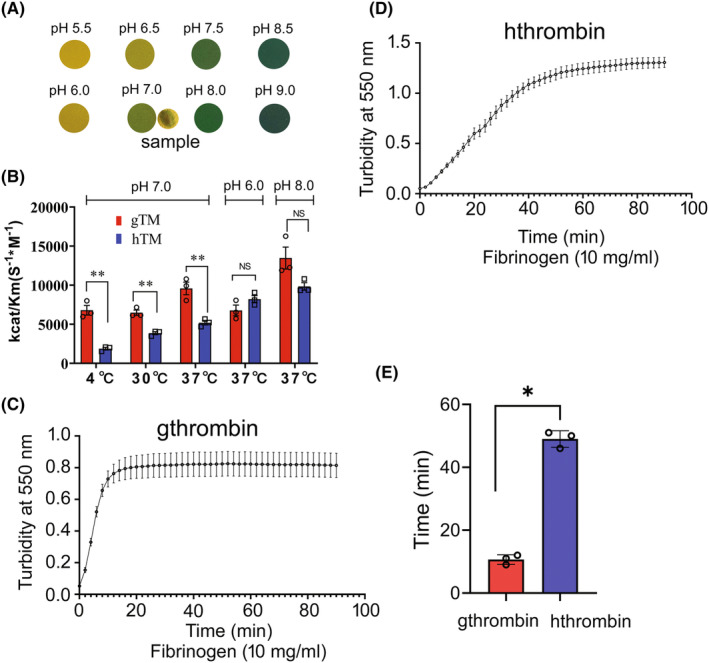
Measurement of enzymatic activity of gthrombin and hthrombin. (A) Examination of tissue fluid pH value following gecko tail amputation. The pH value of the sample was indicated at pH 7.0. (B) The enzymatic activity (kcat/Km) of gthrombin and hthrombin was assayed using synthetic substrate S‐2238 at 4, 30, and 37°C at pH 7.0, and pH 6.0, 7.0, and 8.0 at 37°C, respectively. (C and D) Turbidity assays on human fibrin clots at 10 mg/mL fibrinogen with 1 μg gthrombin (C) and hthrombin (D) in every 2 min following initiation. (E) Comparative analysis of clotting time between gthrombin and hthrombin. The clotting time was determined from the end of the clot lag period to 90% maximum turbidity. All assays were carried out in triplicate. Data are represented as mean ± SEM (p < 0.01).