FIGURE 6.

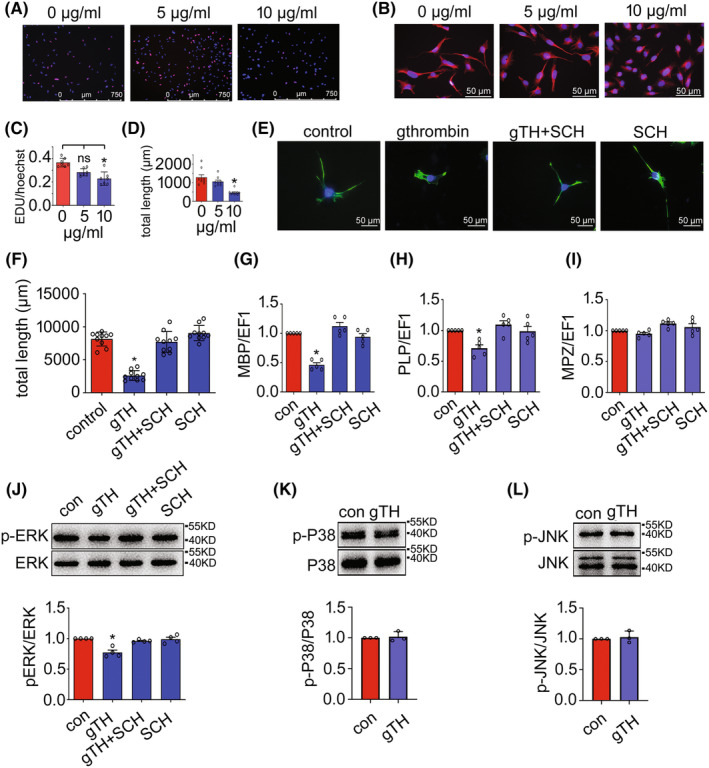
Toxic effects of gthrombin on the gecko oligodendrocytes. (A) EdU assay of gecko oligodendrocyte cell line Gsn3 following treatment with 0–10 μg/mL gthrombin for 24 h. (B) Effects of 0–10 μg/mL gthrombin on the process elongation of Gsn3. (C and D) Statistical analyses of (A) and (B). (E) Exposure of the cells to 500 nM PAR‐1 inhibitor SCH79797 for 24 h attenuated the inhibitory effects of 10 μg/mL gthrombin. (F) Statistical analysis of (C) from 10 fields each 20 cells. Data are represented as mean ± SEM (p < 0.05). Scale bars, 750 μm in (A); 50 μm in (B and E). (G–I) RT‐PCR determination of myelination‐related genes including MBP, PLP, and MPZ following oligodendrocyte treatment with 10 μg/mL gthrombin for 24 h. (J–L) Western blot analysis of the phosphorylated ERK, P38, and JNK following Gsn3 treatment with 10 μg/mL gthrombin for 24 h. Experiments were performed in triplicate. Data are represented as mean ± SEM (p < 0.05).
