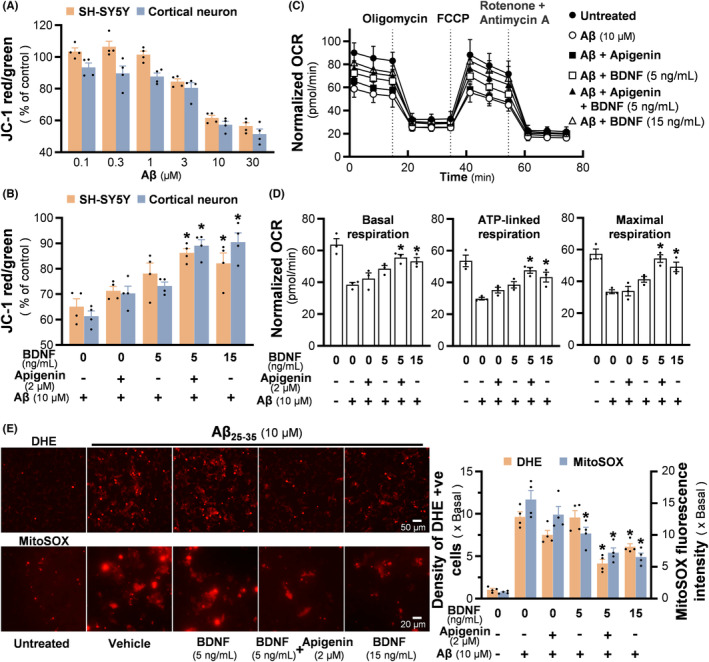
FIGURE 5.

Synergy of apigenin/BDNF protects Aβ‐induced mitochondrial stress. (A) Different doses of Aβ25‐35 were applied onto retinoic acid pre‐treated SH‐SY5Y cells, or cultured cortical neurons for 24 h. MMP was analyzed by a fluorescent microplate reader via JC‐1 method. (B) Cultures were pretreated with apigenin and/or BDNF for one hour, followed by 24 h of Aβ exposure. Then, the protection of apigenin/BDNF on Aβ‐induced MMP loss was tested. (C) Following apigenin/BDNF pre‐incubation and 24 h of Aβ exposure, mitochondrial bioenergetic status of SH‐SY5Y cells was determined by Seahorse Analyzer. Three respiratory chain inhibitors were given to the culture at indicated time points, and the instant OCR was recorded three times after each action. The normalized OCR change with time was shown. (D) Three mitochondrial bioenergetic parameters, i.e., basal respiration, ATP‐linked respiration, and maximal respiration, were quantified by analyzing the OCR in (C). (E) The alleviation of apigenin and BDNF on Aβ25‐35‐induced intracellular and mitochondrial superoxide were tested via DHE and MitoSOX staining (left). The density of DHE‐positive cells and mean MitoSOX fluorescence intensity were quantified (right). Values are expressed as percentage of control, compared to the untreated group, or as normalized OCR, or as the fold of change, in mean ± SEM, n = 3–4. (*) p < 0.05 against Aβ‐treated control.
