
FIGURE 1.
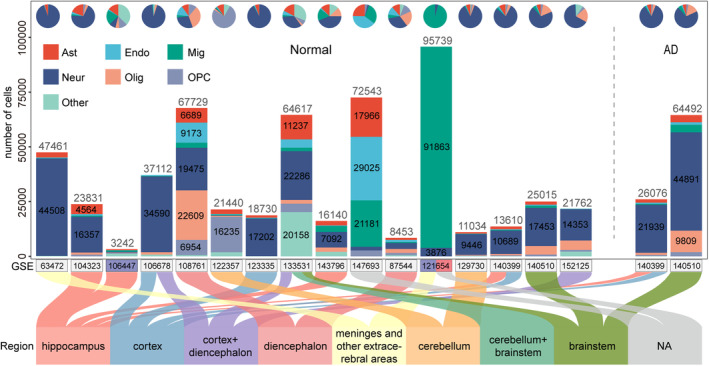
Human scRNA‐seq and snRNA‐seq dataset resource. The bar and pie charts in the top indicated the number of cells in each dataset and the proportion of cell types. The vertical coordinate indicated the number of cells, and the horizontal coordinate indicated datasets, where the color of the horizontal coordinate represented whether there existed gender information (male: blue, female: red). The lower part of the Sankey plot displayed the brain region information for all datasets.