Fig. 6.
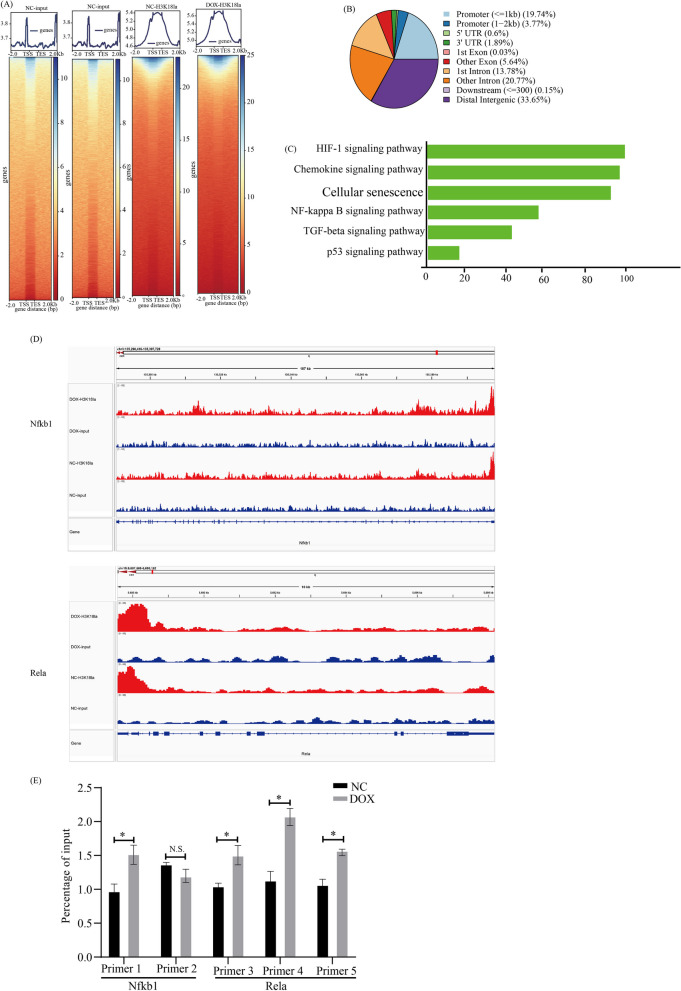
Analysis of the transcriptional consequences of H3K18la in Senescent BV2 Cells. A Heat map displaying the binding density of H3K18la with different H3K18la binding peaks in Dox-BV2 and NC-BV2, ordered by signal strength. B Genome-wide distribution of upregulated H3K18la-binding peaks in Dox-BV2. C KEGG analysis of enhanced H3K18la binding peaks at candidate target genes. D Genome browser tracks of H3K18la binding peaks at the representative target gene loci. The red rectangles indicate the peak regions of H3K18la on Nfkb1or Rela promoters. E Chip-qpcr analysis of the indicated promoter’s regions of Nfkb1 and Rela was performed using antibodies against H3K18la in Dox-BV2 and NC-BV2. Each bar represents the mean ± s.d. for triplicate experiments, *p < 0.05, **p < 0.01, ***p < 0.001, N.S.: no significance

