Figure 9.
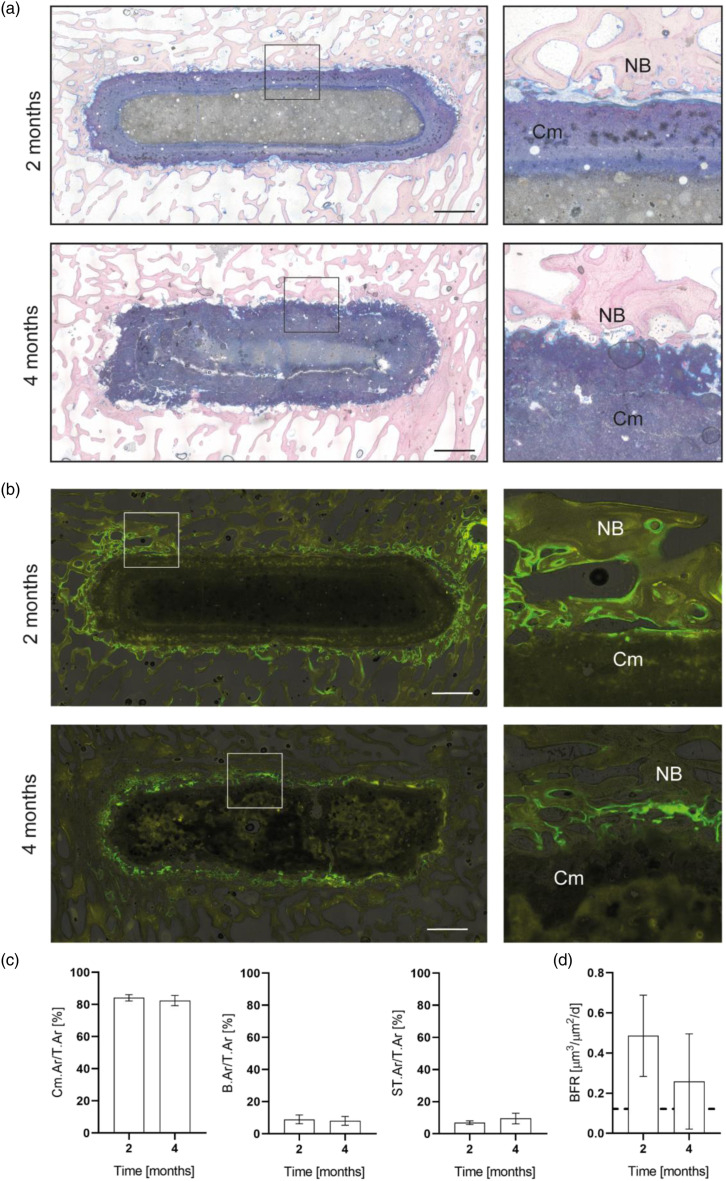
(a) Representative histological images (giemsa staining) and (b) fluorescence images of the newberyite cement at 2 and 4 months after implantation into ovine tibial bone defects. Overviews and magnifications of the bone-implant interface. Scale bar 2.5 mm. Cm – newberyite cement, NB – newly formed bone. (c) Relative cement, bone and soft-tissue area at 2 and 4 months after implantation. Cement area per total tissue area (Cm.Ar/T.Ar), bone area per total tissue area (B.Ar/T.Ar), and soft tissue per total tissue area (ST.Ar/T.Ar), n = 6 for 2 months, n = 7 for 4 months. (d) Bone formation rate (BFR) of fluorescence-labelled bone adjacent to the cement. Dashed line = BFR of surrounding intact trabecular bone, n = 6 for 2 months, n = 7 for 4 months.

